Effective Strategies to Reduce Water Consumption in Industrial Sectors
The fact that data centers account for a significant proportion of electricity consumption is no longer a novelty these days1. The annual electricity consumption of all data centers together is about as much as the industrial nation of Germany2, 3. And the trend is rising. A lot of attention is paid to this issue in the media, in science and politics. However, when it comes to water consumption, the data situation is as scarce as the resource itself.
In this article, we’ll explore how much data center water usage can be and why it can be problematic.
How do data centers influence the water cycle?
- Direct water consumption in the data center. The highest consumption is generated by cooling towers and evaporative coolers followed by air conditioning systems with central chilled water generation. Liquid-cooled racks do not consume water on their own, except when leaks occur, but these are rare. Depending on the region, air humidification can result in water consumption4.
- Indirect water consumption through electricity generation. Depending on the type of power generation, these values can vary greatly. A nuclear power plant requires up to 2.7 l/kWh for cooling5. Wind and solar power, on the other hand, requires less water. This indirect water consumption also has an impact on the water supply systems. Every liter of water consumed directly is accompanied by a share of indirect water consumption6. In the US, indirect consumption accounts for almost 75 % of total data center water usage7.
Data center buildings, are, as many buildings, impervious surfaces, reducing rainwater infiltration and natural groundwater recharge. Instead, rainwater often ends up in the canalization, where it does not benefit the local ecosystem8.
How do data centers measure water usage?
Water consumption alone provides little information about efficiency and environmental compatibility. To be able to compare data centers of different sizes, there is a key performance indicator (KPI) equivalent to the PUE: “Water use effectiveness” (WUE)9. This key figure is calculated by dividing the annual water consumption by the energy consumption of IT equipment10. The lower this value, the more water-efficient the data center is. The best value would be 0 l/kWh or 0 m³/kWh. To include other variables, different standards have added more complexity.
The NGO “The Green Grid” differentiates between WUE und WUEsource. The former only considers the physical water intake of the data center, the latter also adds water consumption of the electricity required to operate the data center11.
The corresponding ISO standard (ISO/IEC 30134-9:2022) provides 3 categories: WUE1 (basic), WUE2 (intermediate) and WUE3 (advanced)12. The first only considers the physical water intake of the data center in m³ and therefore corresponds to the Green Grid definition. The intermediate stage, WUE2, also takes into account if there is non-industrial reuse. Ther third one, WUE3, is by far the most comprehensive metric. It includes both the water intake, the water consumption of the data center energy production, industrial and non-industrial reuse and subtracts rainwater usage from the total intake. Additionally, the data center operator has to report both the regional water stress index and the impervious surfaces area of the data center.
How much water does a data center need?
The data situation is challenging, because of either confidentiality or lack of digital measuring points to monitor water consumption. The paper “Data centre water consumption” (2021, David Mytton) emphasizes the lack of data in its conclusion.
According to a 2016 report by the US Department of Energy, the WUE of the average data center in the USA was assumed to be 1.8 l/ kWh13.
Additionally, some well-known cloud providers publish data.
A 2021 white paper by Google found that their data centers consume 16.3 billion liters of water annually. With 23 data centers, this corresponds to an average consumption of 1.94 million liters per day per data center14. The largest cloud provider, Amazon Web Services (AWS), does not publish water consumption, but makes statements about its WUE: 0.19 l/kWh15, which corresponds to 1/10 of the average USA 2016 data center .
Microsoft publishes both data. In 2022, its water consumption was 6.4 billion liters. With about 180 data centers, this corresponds to only 97,412 liters per day per data center. The average WUE is 0.49 l/kWh16.
Attempts are being made to counteract the problem of the lack of data. The European Energy Efficiency Directive (EED) also requires the publication of the WUE of data centers17. The Climate Neutral Data Centre Pact (CNDCP) is a pledge by industry players (e.g. AWS, Microsoft, Google, and many others, among which AQ Compute) in the data center sector to achieve carbon neutrality by 203018. Among other things, they commit to conserving water and setting annual targets to improve WUE19.
Meta (Facebook) have set themselves the goal of being “water positive” by 2023, i.e. restoring more water than they consume20. In addition, water consumption in critical regions is to be reduced21. Microsoft and Google also plan to be climate-neutral by 2030 and to replenish more water than they consume22.
AQ Compute is aware of the value of water and therefore consumes zero water for the cooling of its data centers, avoiding evaporative cooling systems.
What challenges are associated with high water consumption?
Water consumption is often criticized in the media. To increase the percentage of renewable energy in a data center, using solar power is one option. However, water shortages are also frequent in areas with high solar radiation and daylight hours. For example, about 12% of American colocation data centers are located in California, a state that often suffers from water shortages23. There, they compete not only with the drinking water supply of the population, but also with the water needs of agriculture.
Water availability per person varies significantly by region and has been declining globally, primarily due to population growth. Between 2000 and 2018, the global per capita internal renewable water resources (IRWRs) decreased by approximately 20%. The most substantial declines were observed in regions with already low per capita IRWRs, such as Sub-Saharan Africa (41%), Central Asia (30%), Western Asia (29%), and Northern Africa (26%). In contrast, Europe experienced the smallest decline, at just 3% (FAO, 2022)24.
This data highlights the increasing pressure on water resources in many parts of the world.
The “Water Stress Index” indicates the relationship between water demand and the availability of renewed fresh water. Figure 1 contains a map of the world’s water stress index:
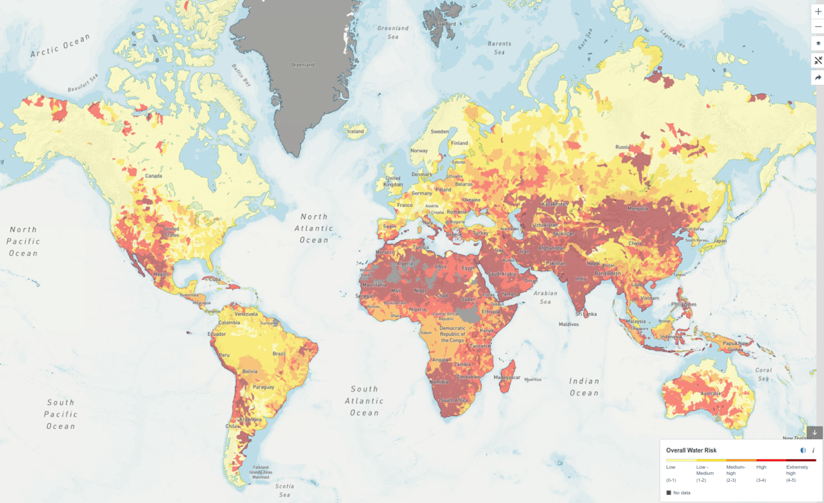
Figure 1: Map of Water Stress Index25
In northern Europe and America, water stress levels are currently low, making the use of water for cooling, such as with evaporative coolers, a viable option that does not significantly impact the local water supply. This is especially true if the alternative is electricity-intensive compression chillers, because, as previously explained, thermal power generation (gas, oil, nuclear) also consume water. However, it’s important to note that this situation could change in the future due to the effects of climate change, potentially altering the availability and sustainability of water resource in these areas.
Why is evaporation an issue?
Technically speaking, for most cooling applications, the water is not “consumed”, it evaporates into water vapour, condenses to form clouds, and precipitates back to earth in the form of rain and snow26. However, the location of this precipitation cannot be controlled. If evaporative cooling is used in areas facing water shortages, the water may move to a different area where it is less needed.
How does data center water usage compare to other sectors?
Let’s examine again Microsoft’s water consumption, where its data centers have an average water consumption of 97,412 liters per day, which is a WUE of 0.49 l/kWh. An average European person consumes 144 litres of water every day27. Therefore, the water consumption of a Microsoft data center, on average, corresponds to the consumption of a small village with about 600 inhabitants. However, data center water usage is not constant over the year. Especially if it is primarily used for evaporative cooling, the water usage is particularly high on warm summer days, when water scarcity may already be an issue. This highlights the importance of considering local water stress levels as well as seasonal effects.
Compared to other sectors, “electricity, gas, steam and air conditioning supply” corresponds to 18.2 % of Europe’s yearly water usage.
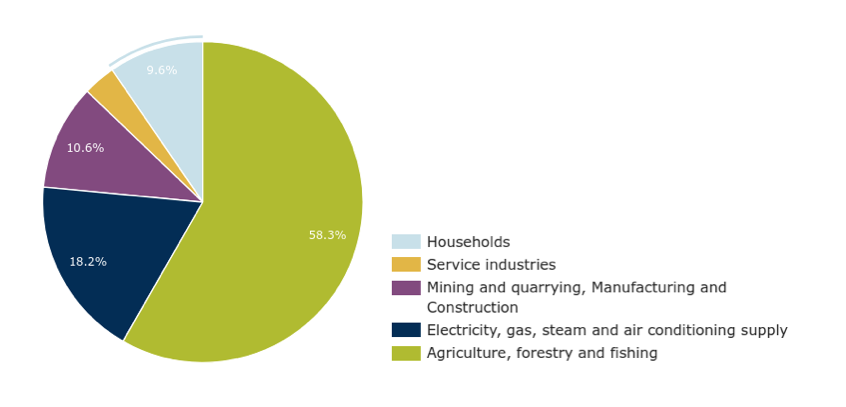
Figure 2: Water use in Europe by economic sector, 201728
Table 1: Annual water consumption by sector, 201729
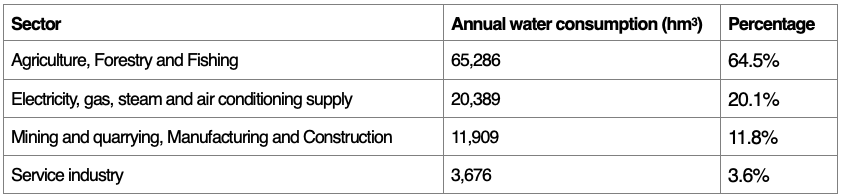
How much water (operational water) do data centers in Europe consume? To make an estimation we will take some assumptions: data centers are running 24/7 but at 80% their installed capacity (which it is assumed to be at a 90% occupied by ITE) and have a WUE of 1,1 L/kWh (an average between the 1,8 L/kWh 2016 value of the Department of Energy of USA -a reference for legacy data centers- and the CNDCP target -a reference for new data centers30). Then, we need to know the amount of installed capacity. This will be assumed as 5,000 MW31. We end up getting to a figure of ca. 35 billion Liters per year. Referencing to table 1, data centers would be at the level of Service industry but 4 to almost 20 lower than other sectors.
This is not a conclusion but a beginning
It has been shown that data centers account for a significant share of electricity and water consumption worldwide. Water consumption, in particular, must be kept in mind, as water may become a rare commodity in the future. Initiatives such as the Climate Neutral Data Centre Pact set targets to reduce water consumption and increase data transparency. However, it is always necessary to correctly classify water consumption in order to assess the impact.
In addition, it is shown that although the WUE is often the focus of the assessment, the WUEsource (Green Grid) or WUE3 (ISO standard) provides better and more holistic information on water efficiency. One significant blind spot is the water consumption in the construction of data centers and manufacture of equipment, such as the production of data center equipment and servers. These are energy- and water intensive processes that are often completely overlooked, with data on them being almost non-existent. To look deeper into the data and the value chain can completely change the perspective. How much water is needed to manufacture the PV panels? Probably, taking the latter into consideration, the water footprint of PV energy turns to be significantly higher. The same applies to data centers and the resources that are needed to build and manufacture them. At some point, not only water (besides of course greenhouse gases -GHG- emissions will be considered) but also the materials footprint of what we build and install. How many kilograms of materials are employed for it and then discarded?32 What about the origin of this materials? Is their exploitation involving armed and social conflicts somewhere? What about the usage of land? As we have seen, water is an important topic and it is gaining a lot of attention after the discussion around GHG is clear, but new metrics and especially metrics with added contexts will raise in the data center sustainability round tables. In the future, many more factors should be included to provide a more accurate assessment of the overall footprint of data centers and the transparent collaboration between all stakeholders involved will help to reach our common goals.
Download the Full Article
[1] https://www.datacenterdynamics.com/en/news/global-data-center-electricity-use-to-double-by-2026-report/
[2] https://www.enerdata.net/estore/energy-market/germany/#:~:text=Power%20Consumption,%3A%20ELECTRICITY%20CONSUMPTION%20(TWh)
[3] https://www.datacenterdynamics.com/en/news/global-data-center-electricity-use-to-double-by-2026-report/
[4] https://www.techtarget.com/searchdatacenter/tip/How-to-manage-data-center-water-usage-sustainably
[5] https://smartwatermagazine.com/news/membracon/nuclear-power-and-water-consumption
[6] https://www.techtarget.com/searchdatacenter/tip/How-to-manage-data-center-water-usage-sustainably#:~:text=Data%20centers%20also%20use%20water,That%20electricity%20generation%20consumes%20water
[7] https://iopscience.iop.org/article/10.1088/1748-9326/abfba1#erlabfba1f2
[8] https://www.sciencedirect.com/science/article/abs/pii/S0022169422001962
[9] https://www.komprise.com/glossary_terms/water-usage-effectiveness-wue/
[10] ISO/IEC 30134-9:2022Information technology — Data centres key performance indicatorsPart 9: Water usage effectiveness (WUE)
[11] https://www.thegreengrid.org/en/resources/library-and-tools/238-Water-Usage-Effectiveness-%28WUE%29%3A-A-Green-Grid-Data-Center-Sustainability-Metric–
[12] https://www.iso.org/standard/77692.html
[13] https://www.osti.gov/biblio/1372902/
[14] https://www.techtarget.com/searchdatacenter/tip/How-to-manage-data-center-water-usage-sustainably#:~:text=In%202021%2C%20Google’s%20data%20centers,gallons%20of%20water%20a%20day
[15] https://www.techtarget.com/searchdatacenter/tip/How-to-manage-data-center-water-usage-sustainably
[16] https://www.techtarget.com/searchdatacenter/tip/How-to-manage-data-center-water-usage-sustainably#:~:text=efficient%20it%20is.-,Microsoft,L%20of%20water%20per%20kWh
[17] https://journal.uptimeinstitute.com/the-energy-efficiency-directive-requirements-come-into-focus/
[18] https://www.climateneutraldatacentre.net/signatories/
[19] https://www.climateneutraldatacentre.net/working-groups/#water
[20] https://tech.facebook.com/engineering/2021/8/facebook-is-committed-to-being-water-positive-by-2030/
[21] https://sustainability.atmeta.com/data-centers/
[22] https://sustainability.google/operating-sustainably/water-stewardship/
[23] https://www.washingtonpost.com/climate-environment/2023/04/25/data-centers-drought-water-use/
[24] FAO (Food and Agriculture Organization of the United Nations). 2022. The State of the World’s Land and Water Resources for Food and Agriculture: Systems at Breaking Point. Main report. Rome, FAO. doi.org/10.4060/cb9910en.
[25] https://www.wri.org/applications/aqueduct/water-risk-atlas/#/?advanced=false&basemap=hydro&indicator=w_awr_def_tot_cat&lat=53.46189043285914&lng=21.313476562500004&mapMode=view&month=1&opacity=0.5&ponderation=DEF&predefined=false&projection=absolute&scenario=optimistic&scope=baseline&threshold&timeScale=annual&year=baseline&zoom=5
[26] https://www.noaa.gov/education/resource-collections/freshwater/water-cycle
[27] https://www.eea.europa.eu/signals-archived/signals-2018-content-list/articles/water-use-in-europe-2014#:~:text=On%20average%2C%20144%20litres%20of,differs%20from%20region%20to%20region
[28] https://www.eea.europa.eu/data-and-maps/daviz/annual-and-seasonal-water-abstraction-7#tab-dashboard-02
[29] https://www.eea.europa.eu/data-and-maps/daviz/annual-and-seasonal-water-abstraction-7#tab-dashboard-02
[30] Assuming a sector growth of 10% annually, in the 2016-2024 period, the capacity has been doubled. https://www.mckinsey.com/industries/technology-media-and-telecommunications/our-insights/investing-in-the-rising-data-center-economy
[31] https://www.voronoiapp.com/markets/Top-50-Biggest-Data-Center-Markets-376#datasource
[32] https://www.monde-diplomatique.fr/2021/10/PITRON/63595