The 3 (or 5) scopes of carbon emissions
The 3 (or 5) scopes of carbon emissions
The most recent ESG commitments of carbon neutrality from sovereign states and big corporations set the carbon neutrality goal in 2050. As Lord Kelvin said: ‘if you cannot measure it, you cannot improve it’. [1] Back in 1998, the GHG (Greenhouse Gases) Protocol established three different scopes for quantifying the carbon footprint of an item (or an activity, product, etc…).[2] During the last 25 years it seems the focus of carbon emissions reduction was rather set on the ones we can directly see (such as the emissions related to the combustion of fuels), but recently the embodied emissions have become more relevant and have been set as the next step to reach carbon neutrality.
In this article we would like to address the following questions:
How are the carbon emissions scopes defined? Which elements of the data centres are accountable for which emissions? Can emissions be double accounted?
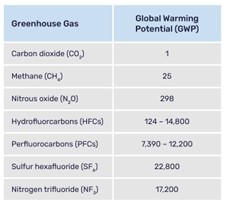
Fig.1 Greenhouse Gases and their Global warming potential. Source: IPCC 2007
First, what does Net Zero mean? The most accepted definition of a Net Zero activity or product is one that achieves the lowest possible amount of greenhouse emissions from its conception and neutralizes the inevitable emissions by removing an equal amount of them.[3] A carbon neutral activity or product will be very similar, but the focus is not set in removing the emissions: the offsetting or balancing by buying CO2 rights is more common in this case. When saying carbon neutrality, as it refers to carbon emissions, one could inflect that other GHG are not considered. There is no official definition for ‘Net Zero’ or ‘Carbon neutrality’, so, ideally, these terms should be explained when they are used.
Another important topic that needs to be addressed is the usage of the words ‘carbon emissions’. Since there are several greenhouse gases, scientists use a simplification normalizing the greenhouse effect of all GHG by comparing them to the effect of the most common one: the carbon dioxide or CO2. The parameter evaluated for the severity of the emissions is the global warming potential (GWP) during the lifetime of the GHG in the atmosphere. The global warming potential of a gas is the quantity of heat it absorbs in the atmosphere as a multiple of the heat absorbed by a same mass of CO2. As an example, the SF6 has a GWP of ca. 22,000 times higher than the CO2, meaning they potentially can absorb 22,000 times more heat than a same mass of CO2 emissions (see Figure 1). As all the GHG are reduced to a comparison with the CO2, the carbon emissions we refer to when talking about global warming effect are called CO2-equivalent (CO2e) emissions and refer as well to all other gases that are emitted during an activity.
Emissions scopes
There are officially three carbon emissions scopes, as depicted in Figure 2:
- Scope 1: direct emissions generated on-site
- Scope 2: emissions associated to electrical power or thermal energy employed in the site
- Scope 3: embodied emissions and upstream-downstream activities associated emissions, including client’s emissions associated to the usage of products or assets, end-of-life treatment, corporative emissions, capital goods
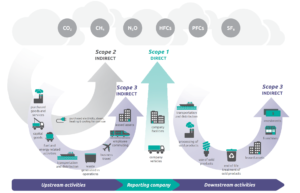
Fig.2 Representation of the three different scopes emissions. Source: WRI/WBCSD Corporate Value Chain (Scope 3) Accounting and Reporting Standard, page 5.
As we can imagine, one same activity can incur a determined emission scope for various stakeholders involved in its deployment. An easy example of this is the electricity used from the grid. To get that electricity to the consumer, it had to initially be generated at a power plant which in many cases causes some form of emissions (e.g., burning fuel to rotate turbines generating power). These emissions are classified as scope 1 for the power plant owner. The users of that electricity will not generate the same emissions themselves but can report those emissions, which for them will fall into scope 2. If these users then employ the same electricity to transform goods (for example, to cut wood and build furniture), this product, if passed to somebody else, will have, ‘embodied’ almost the same amount of emissions that the power plant originally generated,[4] but will fall under scope 3 emission for the next user of the value of chain. In this case, we call this ‘embodied carbon’, because it is an essential part of the elaboration of the product and assimilates to it existence
In data centre infrastructure, different activities can be classified into different scopes depending on the point of view chosen by the reporting party. In the following example, shown at Figure 3, we have three parties: an IT operator providing IT services based in its own IT equipment and/or facility, a Cloud operator providing Cloud services, and a Colocation operator providing data centre space and services, coupled with four scenarios in which they are interrelated when reporting about the emissions of the electrical power employed for their services.
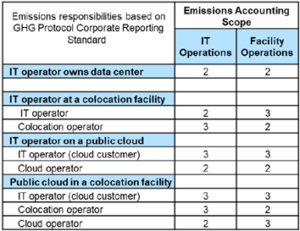
Fig.3 Emissions scopes from three different actors involved in IT and data centre services at 4 different scenarios. Source: The challenges of managing scope 3 emissions, webinar Uptime® Intelligence)
In the last scenario, where the three of them are involved, the emissions associated to the employed power are to be reported by one party, depending on the considered element. The colocation operator provides a facility with power, at a determined temperature, and will report the emissions of the facility as scope 2, but not the emissions of the IT Equipment belonging to the Cloud operator. These are reported as Scope 2 for the latter and Scope 3 for the former. The IT operator is buying services from the Cloud operator, who is offering a virtual infrastructure hosted in its ITE (IT Equipment), which in turn is hosted in a third-party data centre, so will report all the emissions as upstream emissions, belonging to scope 3.
Since all the emissions are shared by the different parties involved one could ask who is accountable for which emissions, and how these are being compensated. To simplify, if all the scope 1 emissions were avoided, there would be no emissions to be compensated on the other scopes. The same happens with the compensation of emissions. Note that a scope 1 or 2 emission only belongs to one party and is transformed into a scope 3 when it jumps into the value chain. It then remains as scope 3 emissions for all the underlying downstream parties. A scope 2 emission is always preceded by a scope 1 emission (plus a usually smaller amount of scope 3 emissions). Therefore, proper measuring and tracking of the emissions is incredibly important to know, to avoid double compensations.
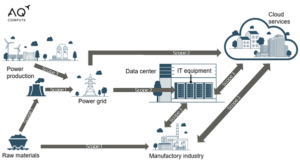
Fig.4 Interconnections of the different carbon scopes emissions. Source: AQ Compute
Table 1 shows what kind of emissions and under what scope happen at a colocation data centre:
| Scope 1 | Scope 2 | Scope 3 |
|
|
[1] Mechanical, Electrical, Plumbing |
Table 1. Examples of different emissions origins classified under the different 3 scopes. Source: AQ Compute’s own elaboration
The origin of the carbon equivalent emissions in a data centre are multiple and involve several stakeholders through the entire lifecycle: during the design phase and all the activities involved, during the procurement of materials and components and the activities of subcontracted companies, during the operational phase for the energy sourcing used also by the tenants of the data centre, and during the end-of-life phase when removing items, whether disposing of or recycling them.
We could be also imaginative and try to define two new carbon scopes:
Scope 0: all the emissions that are not generated due to avoided activities. We should always ask ourselves if what we are building or doing is really required and if not, avoid unnecessary activities and emissions. The most sustainable data centre is the one that is not needed.
Scope 4: avoided emissions that some activities of a party would generate into the emissions scopes of another party but cannot be accounted as any carbon emission scope (nor 1, 2 or 3) for the first one. An example would be the emissions avoided at a heat ‘offtaker’ by recovering the excess heat of a data centre. The avoided emissions resulting from not using gas for heat are not accounted by the data centre but are triggered by its actions. It will belong to avoided scope 1 or 2 emissions of that heat ‘offtaker’ and we could consider them as avoided emissions. On the other hand, excess heat recovery will have a direct effect in the energy efficiency of the data centre because it would need less cooling energy, hence, less power and less emissions (scope 2 emissions).
Food for thought: could water footprint be measured in the same way?
Short answer: yes. However, water footprint is not calculated along scopes 1, 2 and 3, but in indirect and direct uses: the water footprint associated to the building, manufacturing of components, assembling, power production, etc. (indirect use) and the water directly used for cooling/heating purposes, humidifying, cleaning, etc. (direct use).
Conclusion:
We have seen what is to be net zero and how important is to be able to measure the carbon footprint (rather, the carbon equivalent, a simplification of the GHG footprint) of an activity or a product to be able to achieve the ambitious goals set by the sovereign states and the biggest corporations. Due to the interrelation between different parties when dealing with different emissions, sustainability goals are to be achieved by the common work of all the stakeholders involved. Proper measurement and communication between parties is needed to avoid double accounting and to be able to set logical and realistic roadmaps for a net zero future. In the case of data centres, there are multiple sources of GHG emissions and multiple stakeholders involved. The unstoppable digitalization trend will increasingly employ more ITE and data centres and we have a chance to show this trend not as a menace but as an example to be followed by other industries.
Sources:
[1] Lord Kelvin was the mathematician and physicist who defined the homonymous temperature scale with the absolute zero as the lowest temperature possible (-273,15 ºC)
[2] https://ghgprotocol.org/sites/default/files/standards/ghg-protocol-revised.pdf
[3] https://www.un.org/en/climatechange/net-zero-coalition
[4] We should consider the losses at the generation, the transportation and manufacturing
[5] Mechanical, Electrical, Plumbing
Back to Blog