Effective Strategies to Reduce Water Consumption in Industrial Sectors
The fact that data centers account for a significant proportion of electricity consumption is no longer a novelty these days1. The annual electricity consumption of all data centers together is about as much as the industrial nation of Germany2, 3. And the trend is rising. A lot of attention is paid to this issue in the media, in science and politics. However, when it comes to water consumption, the data situation is as scarce as the resource itself.
In this article, we’ll explore how much data center water usage can be and why it can be problematic.
How do data centers influence the water cycle?
- Direct water consumption in the data center. The highest consumption is generated by cooling towers and evaporative coolers followed by air conditioning systems with central chilled water generation. Liquid-cooled racks do not consume water on their own, except when leaks occur, but these are rare. Depending on the region, air humidification can result in water consumption4.
- Indirect water consumption through electricity generation. Depending on the type of power generation, these values can vary greatly. A nuclear power plant requires up to 2.7 l/kWh for cooling5. Wind and solar power, on the other hand, requires less water. This indirect water consumption also has an impact on the water supply systems. Every liter of water consumed directly is accompanied by a share of indirect water consumption6. In the US, indirect consumption accounts for almost 75 % of total data center water usage7.
Data center buildings, are, as many buildings, impervious surfaces, reducing rainwater infiltration and natural groundwater recharge. Instead, rainwater often ends up in the canalization, where it does not benefit the local ecosystem8.
How do data centers measure water usage?
Water consumption alone provides little information about efficiency and environmental compatibility. To be able to compare data centers of different sizes, there is a key performance indicator (KPI) equivalent to the PUE: “Water use effectiveness” (WUE)9. This key figure is calculated by dividing the annual water consumption by the energy consumption of IT equipment10. The lower this value, the more water-efficient the data center is. The best value would be 0 l/kWh or 0 m³/kWh. To include other variables, different standards have added more complexity.
The NGO “The Green Grid” differentiates between WUE und WUEsource. The former only considers the physical water intake of the data center, the latter also adds water consumption of the electricity required to operate the data center11.
The corresponding ISO standard (ISO/IEC 30134-9:2022) provides 3 categories: WUE1 (basic), WUE2 (intermediate) and WUE3 (advanced)12. The first only considers the physical water intake of the data center in m³ and therefore corresponds to the Green Grid definition. The intermediate stage, WUE2, also takes into account if there is non-industrial reuse. Ther third one, WUE3, is by far the most comprehensive metric. It includes both the water intake, the water consumption of the data center energy production, industrial and non-industrial reuse and subtracts rainwater usage from the total intake. Additionally, the data center operator has to report both the regional water stress index and the impervious surfaces area of the data center.
How much water does a data center need?
The data situation is challenging, because of either confidentiality or lack of digital measuring points to monitor water consumption. The paper “Data centre water consumption” (2021, David Mytton) emphasizes the lack of data in its conclusion.
According to a 2016 report by the US Department of Energy, the WUE of the average data center in the USA was assumed to be 1.8 l/ kWh13.
Additionally, some well-known cloud providers publish data.
A 2021 white paper by Google found that their data centers consume 16.3 billion liters of water annually. With 23 data centers, this corresponds to an average consumption of 1.94 million liters per day per data center14. The largest cloud provider, Amazon Web Services (AWS), does not publish water consumption, but makes statements about its WUE: 0.19 l/kWh15, which corresponds to 1/10 of the average USA 2016 data center .
Microsoft publishes both data. In 2022, its water consumption was 6.4 billion liters. With about 180 data centers, this corresponds to only 97,412 liters per day per data center. The average WUE is 0.49 l/kWh16.
Attempts are being made to counteract the problem of the lack of data. The European Energy Efficiency Directive (EED) also requires the publication of the WUE of data centers17. The Climate Neutral Data Centre Pact (CNDCP) is a pledge by industry players (e.g. AWS, Microsoft, Google, and many others, among which AQ Compute) in the data center sector to achieve carbon neutrality by 203018. Among other things, they commit to conserving water and setting annual targets to improve WUE19.
Meta (Facebook) have set themselves the goal of being “water positive” by 2023, i.e. restoring more water than they consume20. In addition, water consumption in critical regions is to be reduced21. Microsoft and Google also plan to be climate-neutral by 2030 and to replenish more water than they consume22.
AQ Compute is aware of the value of water and therefore consumes zero water for the cooling of its data centers, avoiding evaporative cooling systems.
What challenges are associated with high water consumption?
Water consumption is often criticized in the media. To increase the percentage of renewable energy in a data center, using solar power is one option. However, water shortages are also frequent in areas with high solar radiation and daylight hours. For example, about 12% of American colocation data centers are located in California, a state that often suffers from water shortages23. There, they compete not only with the drinking water supply of the population, but also with the water needs of agriculture.
Water availability per person varies significantly by region and has been declining globally, primarily due to population growth. Between 2000 and 2018, the global per capita internal renewable water resources (IRWRs) decreased by approximately 20%. The most substantial declines were observed in regions with already low per capita IRWRs, such as Sub-Saharan Africa (41%), Central Asia (30%), Western Asia (29%), and Northern Africa (26%). In contrast, Europe experienced the smallest decline, at just 3% (FAO, 2022)24.
This data highlights the increasing pressure on water resources in many parts of the world.
The “Water Stress Index” indicates the relationship between water demand and the availability of renewed fresh water. Figure 1 contains a map of the world’s water stress index:

Figure 1: Map of Water Stress Index25
In northern Europe and America, water stress levels are currently low, making the use of water for cooling, such as with evaporative coolers, a viable option that does not significantly impact the local water supply. This is especially true if the alternative is electricity-intensive compression chillers, because, as previously explained, thermal power generation (gas, oil, nuclear) also consume water. However, it’s important to note that this situation could change in the future due to the effects of climate change, potentially altering the availability and sustainability of water resource in these areas.
Why is evaporation an issue?
Technically speaking, for most cooling applications, the water is not “consumed”, it evaporates into water vapour, condenses to form clouds, and precipitates back to earth in the form of rain and snow26. However, the location of this precipitation cannot be controlled. If evaporative cooling is used in areas facing water shortages, the water may move to a different area where it is less needed.
How does data center water usage compare to other sectors?
Let’s examine again Microsoft’s water consumption, where its data centers have an average water consumption of 97,412 liters per day, which is a WUE of 0.49 l/kWh. An average European person consumes 144 litres of water every day27. Therefore, the water consumption of a Microsoft data center, on average, corresponds to the consumption of a small village with about 600 inhabitants. However, data center water usage is not constant over the year. Especially if it is primarily used for evaporative cooling, the water usage is particularly high on warm summer days, when water scarcity may already be an issue. This highlights the importance of considering local water stress levels as well as seasonal effects.
Compared to other sectors, “electricity, gas, steam and air conditioning supply” corresponds to 18.2 % of Europe’s yearly water usage.

Figure 2: Water use in Europe by economic sector, 201728
Table 1: Annual water consumption by sector, 201729
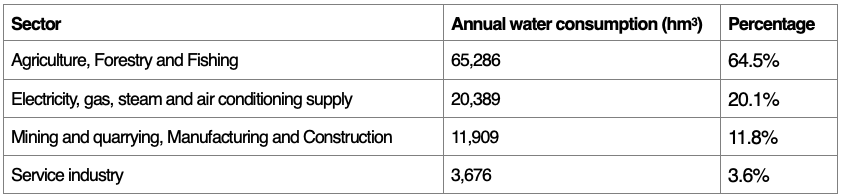
How much water (operational water) do data centers in Europe consume? To make an estimation we will take some assumptions: data centers are running 24/7 but at 80% their installed capacity (which it is assumed to be at a 90% occupied by ITE) and have a WUE of 1,1 L/kWh (an average between the 1,8 L/kWh 2016 value of the Department of Energy of USA -a reference for legacy data centers- and the CNDCP target -a reference for new data centers30). Then, we need to know the amount of installed capacity. This will be assumed as 5,000 MW31. We end up getting to a figure of ca. 35 billion Liters per year. Referencing to table 1, data centers would be at the level of Service industry but 4 to almost 20 lower than other sectors.
This is not a conclusion but a beginning
It has been shown that data centers account for a significant share of electricity and water consumption worldwide. Water consumption, in particular, must be kept in mind, as water may become a rare commodity in the future. Initiatives such as the Climate Neutral Data Centre Pact set targets to reduce water consumption and increase data transparency. However, it is always necessary to correctly classify water consumption in order to assess the impact.
In addition, it is shown that although the WUE is often the focus of the assessment, the WUEsource (Green Grid) or WUE3 (ISO standard) provides better and more holistic information on water efficiency. One significant blind spot is the water consumption in the construction of data centers and manufacture of equipment, such as the production of data center equipment and servers. These are energy- and water intensive processes that are often completely overlooked, with data on them being almost non-existent. To look deeper into the data and the value chain can completely change the perspective. How much water is needed to manufacture the PV panels? Probably, taking the latter into consideration, the water footprint of PV energy turns to be significantly higher. The same applies to data centers and the resources that are needed to build and manufacture them. At some point, not only water (besides of course greenhouse gases -GHG- emissions will be considered) but also the materials footprint of what we build and install. How many kilograms of materials are employed for it and then discarded?32 What about the origin of this materials? Is their exploitation involving armed and social conflicts somewhere? What about the usage of land? As we have seen, water is an important topic and it is gaining a lot of attention after the discussion around GHG is clear, but new metrics and especially metrics with added contexts will raise in the data center sustainability round tables. In the future, many more factors should be included to provide a more accurate assessment of the overall footprint of data centers and the transparent collaboration between all stakeholders involved will help to reach our common goals.
Download the Full Article
[1] https://www.datacenterdynamics.com/en/news/global-data-center-electricity-use-to-double-by-2026-report/
[2] https://www.enerdata.net/estore/energy-market/germany/#:~:text=Power%20Consumption,%3A%20ELECTRICITY%20CONSUMPTION%20(TWh)
[3] https://www.datacenterdynamics.com/en/news/global-data-center-electricity-use-to-double-by-2026-report/
[4] https://www.techtarget.com/searchdatacenter/tip/How-to-manage-data-center-water-usage-sustainably
[5] https://smartwatermagazine.com/news/membracon/nuclear-power-and-water-consumption
[6] https://www.techtarget.com/searchdatacenter/tip/How-to-manage-data-center-water-usage-sustainably#:~:text=Data%20centers%20also%20use%20water,That%20electricity%20generation%20consumes%20water
[7] https://iopscience.iop.org/article/10.1088/1748-9326/abfba1#erlabfba1f2
[8] https://www.sciencedirect.com/science/article/abs/pii/S0022169422001962
[9] https://www.komprise.com/glossary_terms/water-usage-effectiveness-wue/
[10] ISO/IEC 30134-9:2022Information technology — Data centres key performance indicatorsPart 9: Water usage effectiveness (WUE)
[11] https://www.thegreengrid.org/en/resources/library-and-tools/238-Water-Usage-Effectiveness-%28WUE%29%3A-A-Green-Grid-Data-Center-Sustainability-Metric–
[12] https://www.iso.org/standard/77692.html
[13] https://www.osti.gov/biblio/1372902/
[14] https://www.techtarget.com/searchdatacenter/tip/How-to-manage-data-center-water-usage-sustainably#:~:text=In%202021%2C%20Google’s%20data%20centers,gallons%20of%20water%20a%20day
[15] https://www.techtarget.com/searchdatacenter/tip/How-to-manage-data-center-water-usage-sustainably
[16] https://www.techtarget.com/searchdatacenter/tip/How-to-manage-data-center-water-usage-sustainably#:~:text=efficient%20it%20is.-,Microsoft,L%20of%20water%20per%20kWh
[17] https://journal.uptimeinstitute.com/the-energy-efficiency-directive-requirements-come-into-focus/
[18] https://www.climateneutraldatacentre.net/signatories/
[19] https://www.climateneutraldatacentre.net/working-groups/#water
[20] https://tech.facebook.com/engineering/2021/8/facebook-is-committed-to-being-water-positive-by-2030/
[21] https://sustainability.atmeta.com/data-centers/
[22] https://sustainability.google/operating-sustainably/water-stewardship/
[23] https://www.washingtonpost.com/climate-environment/2023/04/25/data-centers-drought-water-use/
[24] FAO (Food and Agriculture Organization of the United Nations). 2022. The State of the World’s Land and Water Resources for Food and Agriculture: Systems at Breaking Point. Main report. Rome, FAO. doi.org/10.4060/cb9910en.
[25] https://www.wri.org/applications/aqueduct/water-risk-atlas/#/?advanced=false&basemap=hydro&indicator=w_awr_def_tot_cat&lat=53.46189043285914&lng=21.313476562500004&mapMode=view&month=1&opacity=0.5&ponderation=DEF&predefined=false&projection=absolute&scenario=optimistic&scope=baseline&threshold&timeScale=annual&year=baseline&zoom=5
[26] https://www.noaa.gov/education/resource-collections/freshwater/water-cycle
[27] https://www.eea.europa.eu/signals-archived/signals-2018-content-list/articles/water-use-in-europe-2014#:~:text=On%20average%2C%20144%20litres%20of,differs%20from%20region%20to%20region
[28] https://www.eea.europa.eu/data-and-maps/daviz/annual-and-seasonal-water-abstraction-7#tab-dashboard-02
[29] https://www.eea.europa.eu/data-and-maps/daviz/annual-and-seasonal-water-abstraction-7#tab-dashboard-02
[30] Assuming a sector growth of 10% annually, in the 2016-2024 period, the capacity has been doubled. https://www.mckinsey.com/industries/technology-media-and-telecommunications/our-insights/investing-in-the-rising-data-center-economy
[31] https://www.voronoiapp.com/markets/Top-50-Biggest-Data-Center-Markets-376#datasource
[32] https://www.monde-diplomatique.fr/2021/10/PITRON/63595
What is the difference between a CPU and a GPU?
Introduction
In the world of computer hardware, there are two main components: the CPU (Central Processing Unit) and the GPU (Graphics Processing Unit). While the CPU has been traditionally used for general-purpose processing1, the GPU has gained in importance with its specialization in graphics and parallel tasks processing. In this article, we will take a closer look at the differences, advantages and disadvantages as well as the respective areas of application of CPUs and GPUs.
Architectures and designs
A CPU is a microprocessor that is responsible for executing instructions and processing data in a computer. It acts as the “brain” of the system and interprets and executes instructions provided by software. To do this, it fetches and decodes data from the memory of the computer. It then executes the commands received from the software.
In contrast, a GPU is specifically designed to process graphics and visualizations, allowing it to handle complex image processing, rendering and other graphics-intensive tasks with high efficiency2.
As schematically shown in Figure 1, the architecture of CPUs and GPUs are fundamentally different: CPUs are optimized for sequential processing, which means that they can perform a small number of consecutive large tasks quickly. They are very versatile, good at handling a variety of tasks, even tasks requiring complex logic and control. GPUs, on the other hand, are designed for parallel processing and can simultaneously process many small tasks at high speed3. CPUs enjoy an internal low latency to switch between tasks, very important for general-purpose computing. GPUs have usually higher memory compared to CPUs, allowing them to handle large amounts of data more efficiently. Since a huge amount of data is required for AI training and it is processed in batches, parallel computation and larger memory from GPUs lead to more efficient training processes.
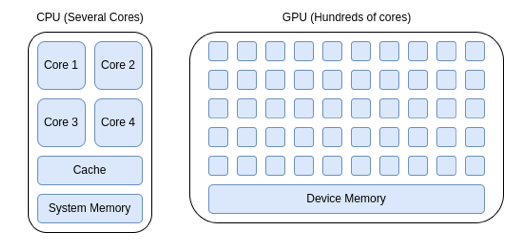
Figure 1- Comparison CPU and GPU architecture, 20244
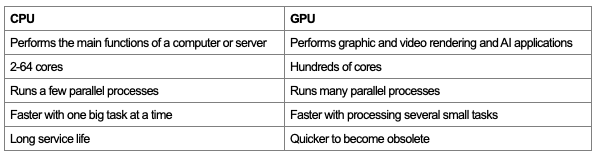
Table 1 shows a comparison of the features between CPUs and GPUs.
Table 1 – Feature comparison: CPU – GPU
The concept of parallel and serial processing can be scaled up from individual components to an entire server network. Depending on the application, there are different ways in which servers can be interconnected in a data center. Star or ring networks can be used for large tasks with little data exchange between servers and with external networks. These are rather outdated and are only used for special use cases such as crypto mining. For HPC or AI applications, it is necessary to combine several servers into a cluster to enlarge the parallel processing capacities needed. These servers must be able to communicate with each other as quickly as possible, which is why mesh networks or fully connected networks are preferred5.
Applications
The CPU, as a general purpose processor, is good at processing a small number of complex tasks. The basic tasks of the CPU range from simple mathematical operations such as subtracting, multiplying and adding, to coordinating the flow of data within a computer and running the operating system. More specialized tasks include video and audio decoding, encryption and decryption algorithms and SIMD (single instruction, multiple data) tasks. For example, a typical multi-threaded benchmark (i.e. a test in which all CPU cores are utilized) is OpenSSL6, in which an RSA key7 with a bit length of 4096 is calculated8.
The GPU was originally created for graphically displaying the commands processed by the CPU on a screen9. However, as GPUs can compute with high degrees of parallelization thanks to the large number of computing cores, most AI algorithms and deep learning models consisting of “neural networks”10 use them. Neural networks consist of millions of nodes and connections, which can best be simulated using many cores. Parallelization also has the advantage when training such models, since multiple scenarios can be calculated simultaneously thus reducing training time11. Another major advantage of the GPU is the “Video Random Access Memory” (VRAM). This is a fast buffer memory into which the large training data and results can be loaded. The VRAM can comprise up to 24 GB of memory, and is therefore considerably larger than the cache memory of the CPU which is often in the two-digit MB range12.
HPC and AI
High-performance computing (HPC) and artificial intelligence (AI) are both separate concepts yet closely linked at the same time. In the past, HPC was mainly focused on scientific research. Supercomputers were used in universities and research institutes to carry out complex calculations such as simulations. These supercomputers were traditionally mostly based on CPUs. AI is a subset of HPC and is becoming more developed in the commercial field, employing mostly GPUs. AI is changing the requirements for computing clusters in commercial data centers, since the hardware they use and the cooling requirements they have are different from classic cloud computing. AI, HPC, their similarities and differences, will be remarked in a separate article.
Power and efficiency
In addition to performance, energy efficiency and thermal aspects play an important role for CPUs and GPUs. In this context, there are two criteria, which are explained below: thermal design power (TDP) and general efficiency.
TDP is measured in watts (W) and represents the maximum theoretical heat output a component can produce. It is important to remember that TDP is not the average power consumption, but equals the maximum power consumption under the maximum load that the processor can support. Components which can handle intense workloads often have a higher TDP and generate more heat. CPUs and GPUs will use less power during low intensity tasks like browsing the web or checking emails. Generally, due to the demanding processing nature of graphics processing, GPUs tend to have higher TDPs compared to CPUs.
TDP plays a key role in choosing the right cooling solution for a system. Components with higher TDPs might require more efficient cooling systems such as liquid cooling, while those with lower TDPs might function well with air coolers.
As Figure 2 shows, there is an upward trend in TDP values over time. While this trend tends to be lower for CPUs, the V100 and H100 GPUs, for example, have seen their TDPs double in a short timeframe. TDPs are expected to rise to up to 4000 W by 203013. Such high TDPs will place special demands on cooling and make liquid-based cooling systems necessary.
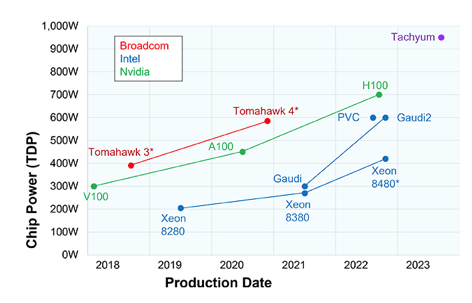
Figure 2 – TDP evolution per chip manufacturer and model14
Computing efficiency
While TDP helps us understand a component’s thermal output, it does not tell the whole story when it comes to performance. That is where efficiency comes in. Here, efficiency refers to a component’s ability to get the most work done while consuming the least amount of power, ideally delivering high performance with low power consumption.
Unfortunately, there is no single, universally accepted metric for measuring CPU and GPU efficiency. For CPUs, metrics like instructions per watt (IPS/W) or floating-point operations per watt (FLOPS/W) are commonly used. These metrics indicate how many instructions or calculations a component can perform per watt of power consumed. A higher number signifies better efficiency15.
For GPUs, frames per second per watt (FPS/W or FPW) can be considered for measuring efficiency. This metric reflects how many frames a GPU can render per watt of power, giving you an idea of its computing efficiency. A higher value equals better efficiency, but not always higher performance16.
One way to measure the performance of a server, considering its different components and tasks, is the SERTTM (Server Efficiency Rating Tool) which was developed by SPEC® in collaboration with the U.S. Environmental Protection Agency.
Innovations and trends
The IT hardware sector continues to evolve rapidly. One of the most exciting innovations is the so-called “multi-chiplet design”. Instead of a single large monolithic chip, several chips that are easier to produce are combined to provide the same functionality (see Figure 3). These chiplets are more flexible than conventional chips because individual functional groups can be replaced depending on requirements17, 18.
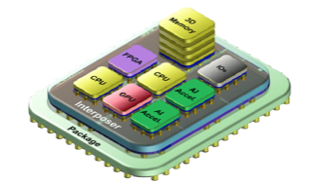
Figure 3 – Example of the chiplet partitioning concept19
In semiconductors, an important factor is the structure width, which indicates how many transistors can be arranged on a certain area. Put simply, more transistors means more computing power20. While Intel has been producing structure widths of 7nm since 2022, TSMC made the leap to 3nm structures in 2022. TSMC uses this structure to manufacture the M3 CPU for Apple, for example21. It is expected that TSMC will be able to realize 2nm structure widths from 202522.
The GPU market is dominated by NVIDIA in both the data center and consumer markets. NVIDIA has now introduced the new generation of “Blackwell” GPUs. According to Ian Buck (Nvidia’s vice president), the new model enables AI models to be trained four times faster and with up to 25 times better energy efficiency than the previous Hopper architecture23.
AMD is also making an impact on this market with its MI300 series chipsets. However, this product is not a pure GPU. For reference, the AMD Instinct MI300A combines 228 GPU compute units and 24 “Zen 4” x86 CPU cores24. For Q1 2024, sales of the MI300 totaled USD 2.3 billion out of USD 5.45 billion in sales, making it AMD’s best-selling product25, 26.
Intel is also developing in this area and is offering an AI accelerator (not a GPU) with the Intel Gaudi 3 chipset line, which allegedly delivers 50% faster AI performance with 40% better energy efficiency than the H100 from NVIDIA. Interestingly, the Gaudi has a structure width of 5nm27.
In some instances, AI computing uses general-purpose hardware such as CPUs and GPUs28. However, one other possible approach is to customize the hardware for its specific application. One subfield of computer science that has been developed for a specific application is neuromorphic hardware, designed to mimic the structure and function of natural brains. For example, the Intel Loihi 2 can simulate 1 million neurons on each 31 mm2 chip29. For scale, a mouse brain has 71 million of neurons (14 million of which are in the cortex)30.
On the other hand, XPUs, a term encompassing a variety of specialized processing units such as FPGAs (Field-Programmable Gate Arrays) and TPUs (Tensor Processing Units), are also emerging to handle specific computational tasks more efficiently. These units offer customizable hardware solutions, accelerating applications in machine learning, data centers, and high-performance computing.
Conclusions
CPUs and GPUs are two of the most important components in data centers. CPUs are all-rounders that perform general tasks such as running the operating system and programs as well as performing calculations. The strength of CPUs lies in the sequential processing of a small number of complex tasks. They have a small number of cores (1-64), offering high performance. Graphics processors, on the other hand, specialize in visual tasks, including graphics processing and rendering, and are currently becoming increasingly important for artificial intelligence. Their strength lies in the parallel processing of many small tasks. This is made possible by the high number of cores (hundreds) and high graphics memory.
The newest GPUs, CPUs, and emerging hardware like XPUs and neuromorphic systems are revolutionizing the computing arena. CPUs will keep increasing their efficiency and performance through advanced architectures, staying as the most versatile option for general-purpose tasks. GPUs, essential in AI, big data analytics and simulation applications, will likely see further improvements on components such as memory bandwidth, and on core designs specifically conceived for machine learning.
As software and workloads become more heterogeneous, the demand for XPUs will grow, developing specific hardware to respond to each specific application needs. Neuromorphic hardware will transform how machines interpret their environment and will likely drive innovations in robotics, autonomous vehicles, and cognitive computing. Specific hardware architectures should allow more energy-efficient computing paradigms.
The future of hardware for computing will facilitate specialization and diversification. The advancements in this field will enable current applications to be faster and better, enabling new applications and technologies. The boundaries of physical limitations are being pushed, generating new architectures allowing incredible processing capacities, narrowing the distance between the performance of human brains and the newest computers being manufactured today.
Download the Full Article
[1] https://www.cancom.info/2023/11/deshalb-sind-grafikkarten-fuer-ki-loesungen-unverzichtbar/
[2] https://www.heavy.ai/technical-glossary/cpu-vs-gpu
[3] https://www.run.ai/guides/multi-gpu/cpu-vs-gpu
https://kariera.future-processing.pl/blog/when-processor-is-not-enough/
[4] Source: own elaboration
[5] https://www.hpcwire.com/2019/07/15/super-connecting-the-supercomputers-innovations-through-network-topologies/
[6] https://en.wikipedia.org/wiki/OpenSSL
[7] https://en.wikipedia.org/wiki/RSA_(cryptosystem)
[8] https://aws.amazon.com/what-is/cpu/?nc1=h_ls
[9] https://www.intel.com/content/www/us/en/products/docs/processors/what-is-a-gpu.html
[10] https://news.mit.edu/2017/explained-neural-networks-deep-learning-0414
[11] https://www.run.ai/guides/gpu-deep-learning
[12] https://www.pcworld.com/article/2066872/how-does-cpu-memory-cache-work.html#:~:text=A%20good%20base%20for%20the,perfectly%20fine%20for%20most%20purposes.
[13] https://www.ri.se/en/news/blog/generative-ai-must-run-using-liquid-cooling
[14] https://www.techinsights.com/blog/editorial-its-getting-hot-here
[15] https://www.intel.com/pressroom/kits/core2duo/pdf/epi-trends-final2.pdf
[16] https://lazer3d.com/2023/06/27/rtx-4060-the-new-power-efficiency-king/
[17] https://www.all-electronics.de/automotive-transportation/diese-vorteile-bieten-chiplets-gegenueber-socs-auch-im-auto-571.html
[18] https://resources.pcb.cadence.com/blog/2023-all-about-chiplet-technology
[19] IntAct: A 96-Core Processor With Six Chiplets 3D-Stacked on an Active Interposer With Distributed Interconnects and Integrated Power Management, Vivet et al., 2020, IEEE Journal of Solid-State Circuits
[20] https://ourworldindata.org/moores-law
[21] https://www.golem.de/news/apple-m3-ein-wunder-war-nicht-zu-erwarten-2311-178998.html
[22] https://www.heise.de/news/TSMC-Diese-Verbesserungen-bringen-2-Nanometer-Strukturen-9054463.html
[23] https://www.datacenterknowledge.com/hardware/nvidia-launches-next-generation-blackwell-gpus-amid-ai-arms-race
[24] https://www.amd.com/en/products/accelerators/instinct/mi300.html
[25] https://www.fierceelectronics.com/ai/amd-mi300-ai-shipments-helped-drive-q1-revenue-growth
[26] https://www.theverge.com/2024/4/30/24145856/with-1b-in-sales-amds-mi300-ai-chip-is-its-fastest-selling-product-ever
[27] https://wccftech.com/intel-gaudi-3-ai-accelerator-5nm-128-gb-hbm2e-900w-50-percent-faster-nvidia-h100/
[28] https://www.embedded.com/optimizing-embedded-edge-ai-with-neuromorphic-computing/
[29] https://www.intel.com/content/www/us/en/research/neuromorphic-computing-loihi-2-technology-brief.html
[30] https://www.intel.com/content/www/us/en/research/neuromorphic-computing-loihi-2-technology-brief.html
Liquid cooling in data centers
increasing efficiency and necessity for future viability
Introduction
This article provides an introduction to the world of liquid cooling in data centers. It lists the advantages and challenges over conventional air cooling, briefly explains its thermodynamic principles and compares different liquid-based cooling concepts. This is followed by a categorization of the area of application and what innovations can still be expected in this area.
Previous applications of liquid cooling
Although it may seem like liquid cooling is the newly discovered star in the IT cooling sky, this technology has been playing an important role for many years. In fact, everyday life is indirectly influenced by water-cooled technology: liquid-cooled high-voltage transformers have been used in power supply for around 200 years and liquid-cooled combustion engines have also become indispensable in the automotive sector1.
IBM’s System/360, the first liquid-cooled computer, appeared in 1964. In the 1980s, liquid cooling was very popular for supercomputers. However, technology went through a series of ups and downs until the early 2000s, when it began a steady upward trend. This is due to the rapidly increasing power densities required by high performance computing, artificial intelligence and crypto mining. In the last decades, the consumer PC market has also been conquered by liquid cooling sets2. Their focus here is on silent cooling, efficient overclocking and, colorful RGB lighting3,4.
Purpose of liquid cooling
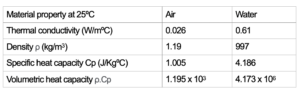
Liquid cooling offers numerous advantages over conventional air cooling, which are both economically and ecologically significant. When talking about liquid cooling, we often implicitly talk about water cooling. A fundamental physical relationship illustrating liquid cooling’s superiority lies in the combination of high density and high heat capacity of water (Table 1). Compared to air, water can capture and transport a considerably greater amount of heat per unit volume. This enables more efficient heat dissipation.
Table 1: Comparison of the material properties of the thermodynamics of air and water
This results in a lower mass flow that has to be moved in order to achieve the same cooling capacity (Figure 1). As a result, less energy is required to operate the cooling system, which leads to improved energy efficiency. Less moving mass also means less effort for mechanical elements, which in turn leads to lower operating costs.

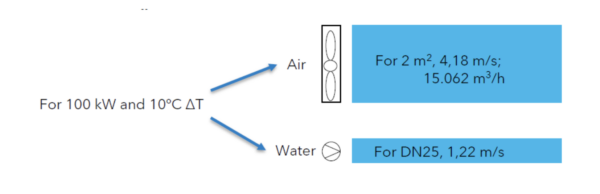
Figure 1: Volume flow of air and water with the same heat transfer
Water is a phenomenal fluid for heat extraction but not the only one that is being employed. If we consider other fluids used in liquid cooling, their volumetric capacity remain superior to that of air due to the higher density of these liquids, some of them even higher than water (e.g. HFE 7100 density is 1510 kg/m3). Another significant advantage of liquid cooling is the ability to maintain a higher temperature level in the cooling circuit. Following the previous illustrations, the dissipation of a quantity of heat at a certain temperature assuming similar heat-exchanging surfaces will allow lower delta T. While air-cooled data centers are operated at an air temperature of approx. 27°C, it is possible to operate a liquid cycle for server cooling between 45°C and 60°C, as discussed below. This has two advantages. On one hand, the higher temperature level returning from the cooling circuit enables a greater proportion of free cooling. At low ambient temperatures (lower than 16 ºC5), water cooling can be operated without energy-intensive chillers, which leads to considerable energy savings and investment costs.
On the other hand, it enables the effective utilization of waste heat, diverting the heat from cooling towers and dry-coolers to surrounding heat demands. The recovered heat can be used, for example, to heat buildings or supply processes requiring thermal energy, resulting in better resource usage and cost savings on the data center (no need for additional artificial removal of the heat) and heat demand sides (no need to generate heat) (see our past blogpost).
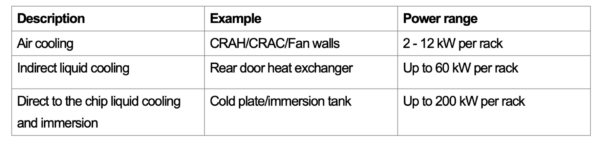
For classification purposes, the following are the power density values that different cooling methods can cope with:
Table 2: Rack power density through different cooling methods
Cooling fluids
Water-based liquids
Water-based liquids are used for indirect and direct to chip liquid cooling, with de-ionized water being used in cooling circuits to practically eliminate their electrical conductivity and potential chemical corrosion effects produced by ions and minerals present in the water. Furthermore, corrosion inhibitors and biocides are added to the cooling liquids to protect against electrochemical corrosion of the system components and to inhibit the growth of organic matter. For outdoor cooling circuits, e.g. for free cooling, antifreeze must also be added (ethylene/propylene glycol) to prevent the coolant from solidifying and causing frost damage at temperatures below 0 °C. It is becoming more common to find the antifreeze propylene glycol (PG) within the primary cooling circuits at a server level, because it helps to stabilize the fluid and requires less treatments6. Since water is the source of life, it can be challenging to keep water stable and clean, particularly when heated in a non-uniform way (some servers on, others off, some hotter than others) within a closed loop in contact with different metals and plastics.
Immersion fluids
In contrast to cold plate cooling, with immersion cooling the server is completely immersed in a special cooling fluid. The cooling fluids are thermally conductive and dielectric (electrical non-conductive) liquids, which can be divided into four subgroups7: Mineral oils; de-ionized water; Perfluorocarbon-based fluids and synthetic fluids.
The choice of fluid depends on various factors. Mineral oils, and possibly in the future de-ionized water (some research has been done with power electronics but not with hardware yet8), are more suitable for single-phase systems while perfluorocarbon-based and synthetic fluids are more suitable for cooling systems with phase transition. The exact functioning of these techniques is explained further below. Other aspects also have an influence on the choice of coolant. Some immersion fluids have a high GWP (Global Warming Potential), while others are toxic.
Liquid cooling in white space
Indirect liquid cooling
With indirect liquid cooling, the waste heat from the servers is transferred directly from the air to a liquid (generally a water-based liquid) at the rack and then transported out of the white space. Classic air-cooled servers reject the heat with air volume flow through the server using their internal fans. Cold air is flown into the IT-room to absorb the emitted heat from the chips, hard disks, RAM, power supply units, etc., via heat sinks and their outer surfaces, and is blown out at the rear of the server at a higher temperature (Figure 2).
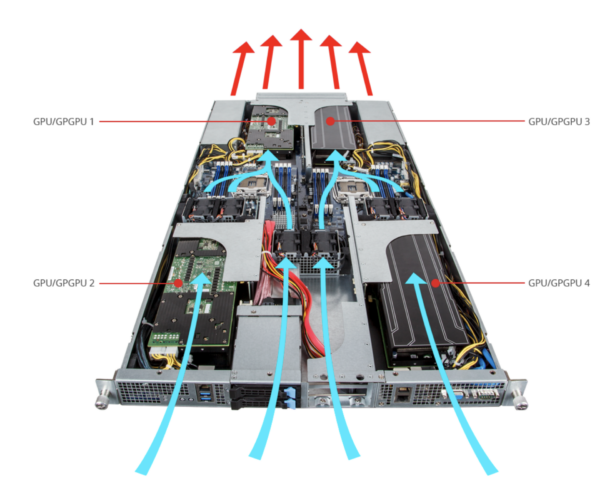
Figure 2: Air flow of an air cooled GPU-Server9
In the case of CRAHs and fanwalls, these devices are placed at the perimeter of the IT space or integrated in its walls. In the case of rear door heat exchangers (RDHx), air-liquid heat exchangers fitted with fans, are installed at the rear of the racks (Figure 3). A coolant with a temperature generally between 18 °C and 27°C10 flows through their heat-exchanging coils cooling down the warm air from the servers, allowing cooling capacities of up to 78 kW/rack11 to be achieved12.
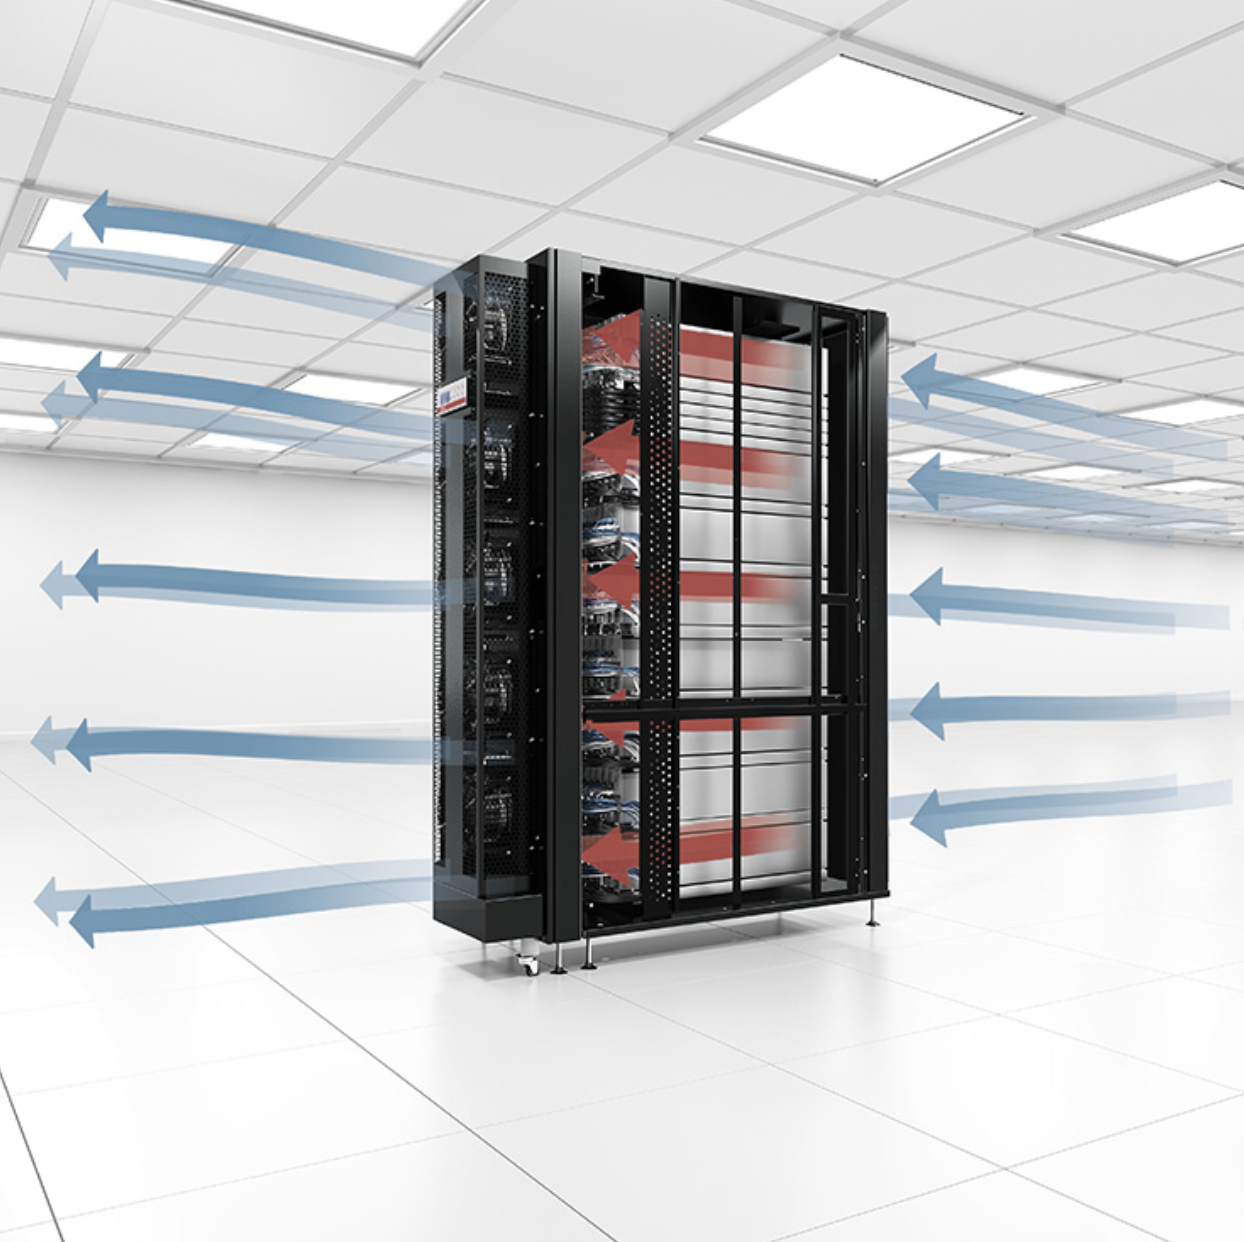
Figure 3: Rack with rear door heat exchanger13
In contrast to typical air-cooled server rooms, the hot air is cooled down to the temperature level required for the server entry directly as it exits the rack. As a result, this cooling system does not generate any warm air outside the rack needing to be routed separately from the cold air, thus eliminating the need for an enclosure for separate air routing. A Coolant Distribution Unit (CDU) can be employed to separate the closed cooling circuit from a secondary one connected to the chillers’ facility and to monitor and control the distribution of the coolant to the rear door cooler (at a rack level). Depending on the temperature difference between the return coolant and the outside of the data center, free cooling can be used to dissipate heat to the environment instead of needing a chiller.
Direct to chip liquid cooling
Direct to chip liquid cooling technology goes one step further and supplies the cooling liquid into the server, right up to the heat source (CPU, GPU, RAM, etc.). Heat sinks with liquid flowing through them are attached to the heat-emitting components to cool them (Figure 4). Due to the better heat transfer coefficients of liquids compared to air as explained above, the cooling liquid can reach more than 50 ºC at the server outlet, depending on the server type14. Furthermore, liquid-cooled servers benefit from the higher heat capacity and density of the liquid, in the form of a more compact design with an associated higher power density (up to 100 kW/rack)15. In the rack, the servers are connected to manifolds (Figure 5) for liquid distribution using generally dripless quick-release couplings and thus flow through in parallel.
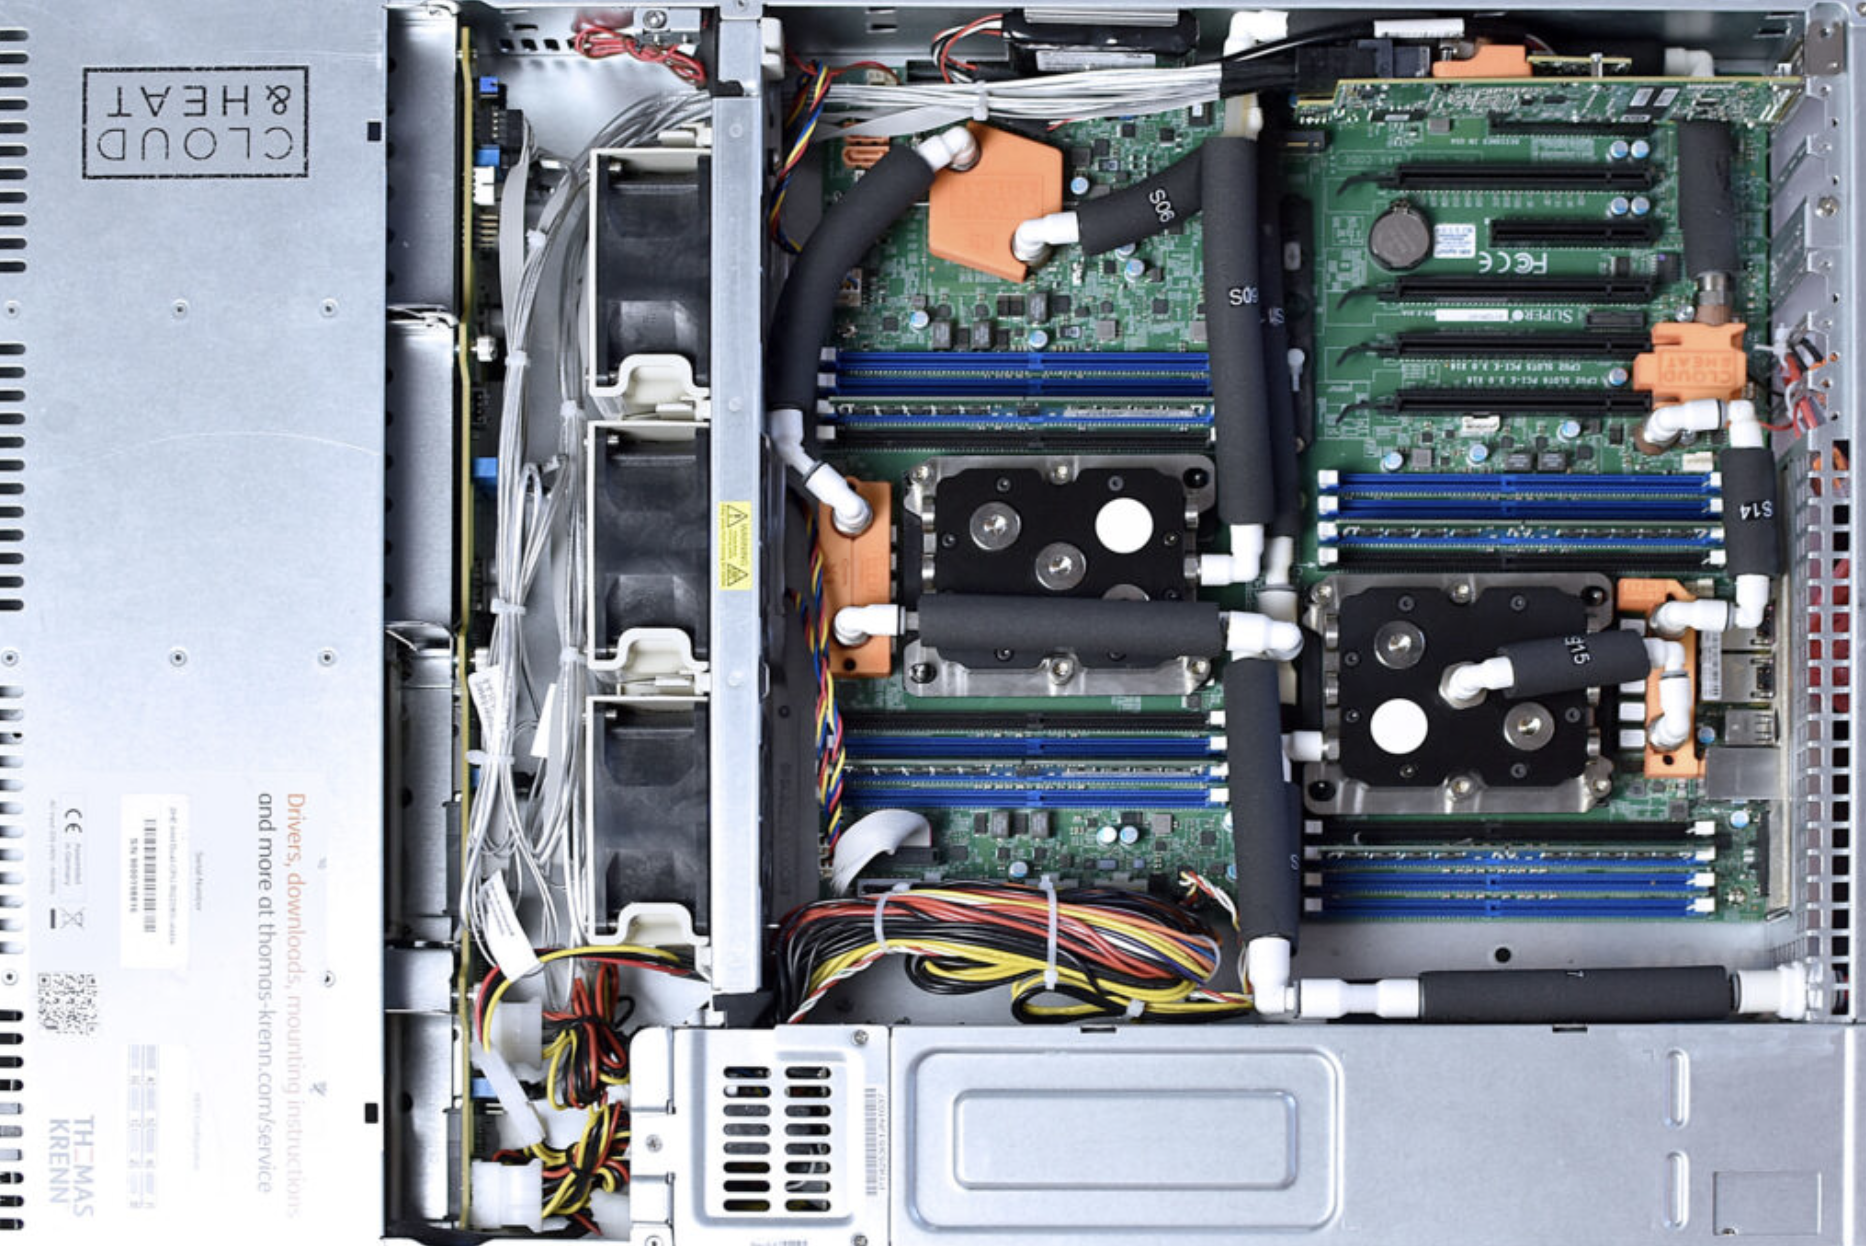
Figure 4: Cloud&Heat Technologies, Direct to chip cooled server16
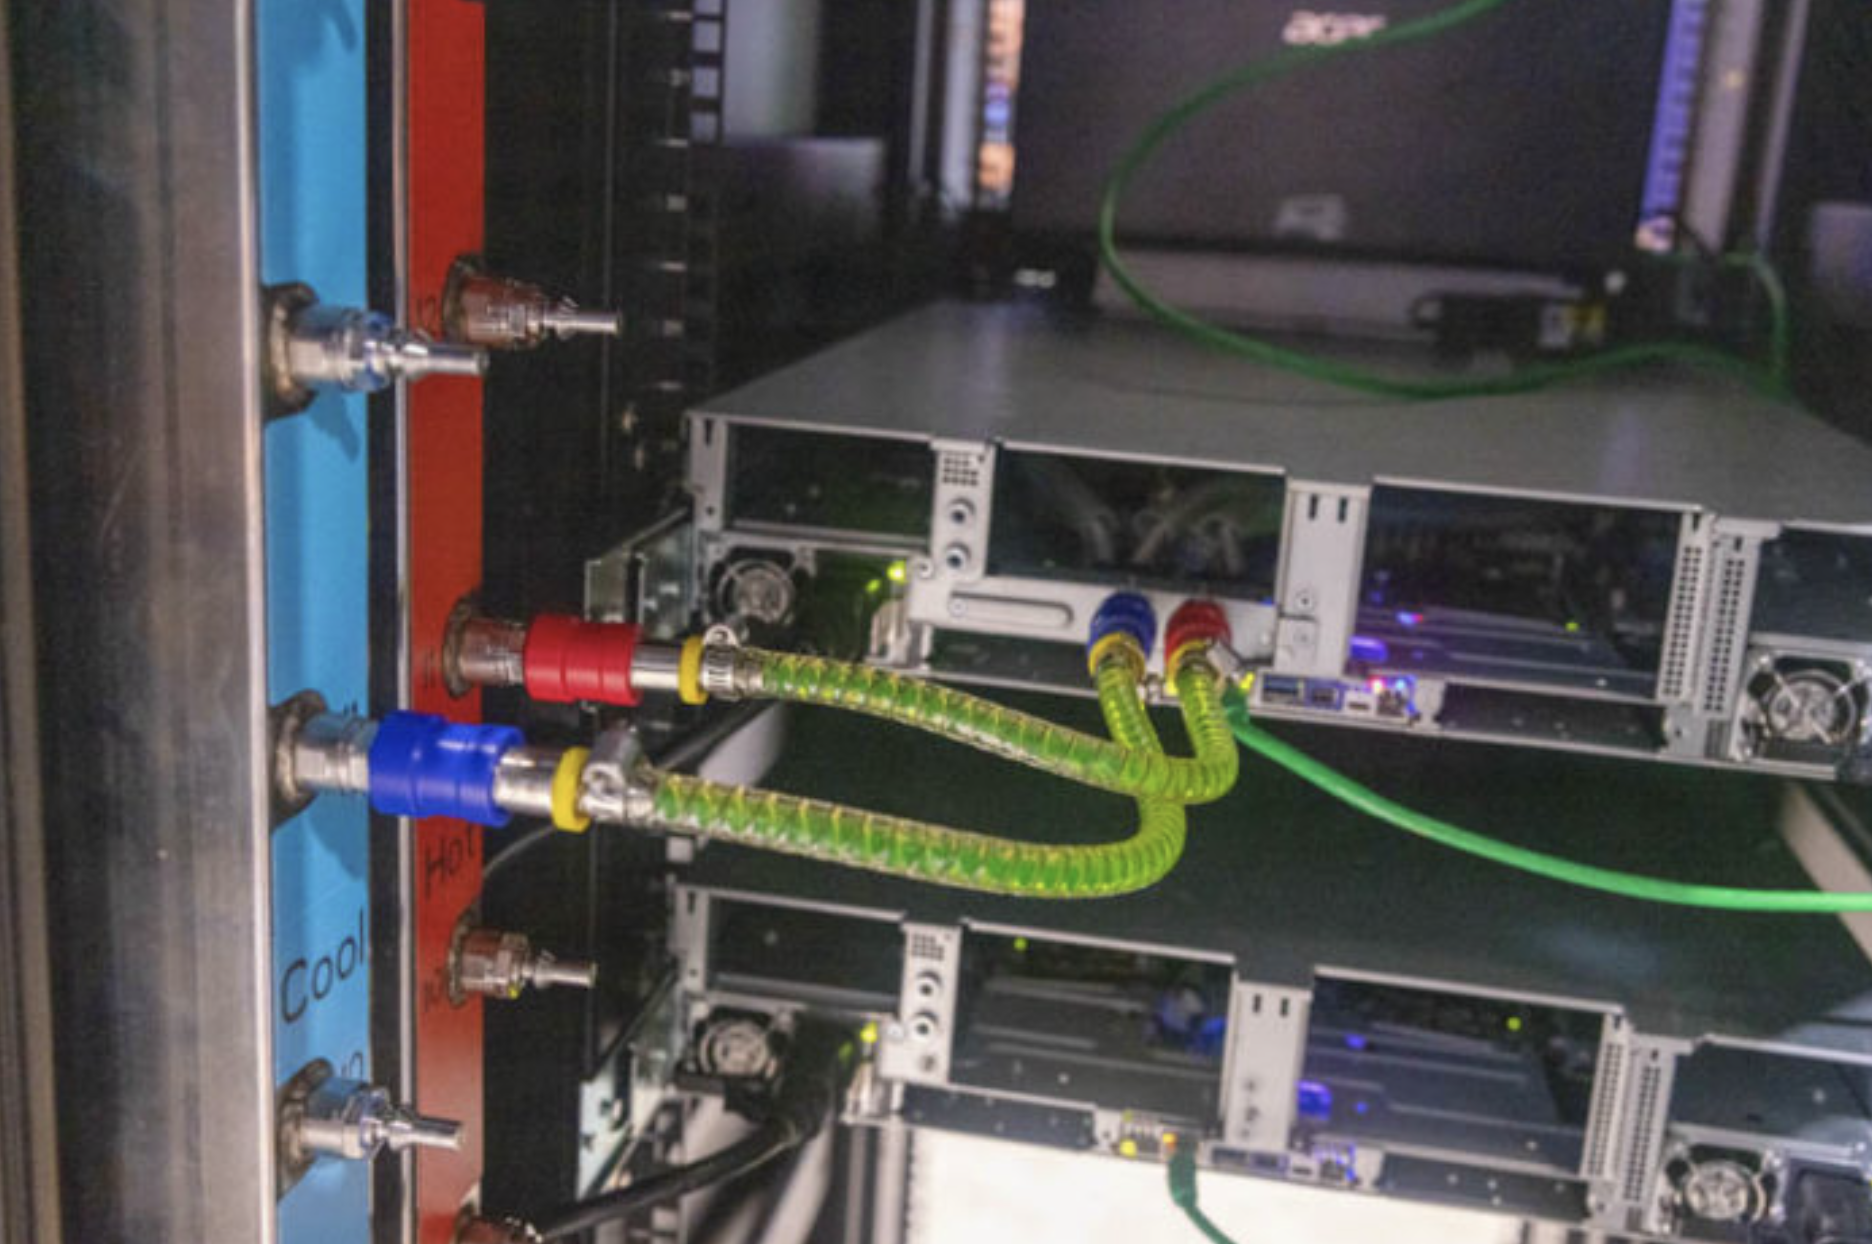
Figure 5: Manifold (left) in a rack for direct to chip liquid cooled server17
With liquid-cooled servers, generally only a few components such as hard disks, power supply units and, in some cases, RAM, emit heat into the air, which means that the use of additional air-cooling devices and their space-intensive air heat exchangers can be reduced to a minimum. Even if there are examples of cold plates for hard drives18, the extraction of heat is usually not significant enough to justify its extensive deployment and, moreover, their hot-plug and extraction can be compromised. A CDU uses pumps and valves to control the distribution of the cooling liquid to the racks, depending on their cooling requirements, and monitors the closed liquid circuit. Different topologies of circuits are used, from a circuit with its own CDU in the rack to a central CDU with coolant distribution to several rows of racks. When high liquid temperatures are employed in the circuit, free cooling can be operated all year round via a liquid circuit to the environment and energy-intensive compression chillers can be dispensed with. In addition, the high temperature level of the coolant allows the extracted heat to be recovered, for example for heating buildings, swimming pools or greenhouses, thus saving CO2 elsewhere.
Due to the still lower market availability of completely liquid-cooled servers, hybrid servers, which are partially liquid and air cooled, are currently often used. In combination with rear door coolers (Indirect fluid cooling), a completely liquid-cooled white space, controlled via a CDU, can nevertheless be operated and converted to direct to chip liquid cooling with little effort in the future.
Immersion cooling
As already explained above, immersion cooling requires immersing the entire server in engineered liquids or adapted natural fluids. This liquid can either circulate actively or passively in the tank. Before the server is immersed, it needs to be modified, e.g. the fans must be generally dismantled as well as the massive heat sinks from the top of the chips to ensure proper functioning. The temperatures reached by the immersion cooling systems can be similarly high as with the cold plates, and heat extraction with immersion systems is almost 100% due to minimal heat dissipation in the air, significantly reducing the needs for artificially cooling the IT space.
Essentially, two different methods of immersion cooling can be distinguished:
Single-phase immersion cooling
In single-phase immersion cooling, the servers are immersed in a tank (Figure 6) containing a single phase of a special cooling liquid, which typically has a high thermal conductivity. The heated liquid circulates either actively using pumps or passively due to temperature differences through a heat exchanger and transfers the heat to an external circuit for cooling (free cooling or heat reuse circuit analogously as by cold plate systems). As already mentioned, this can be achieved with fluids such as mineral oil19.
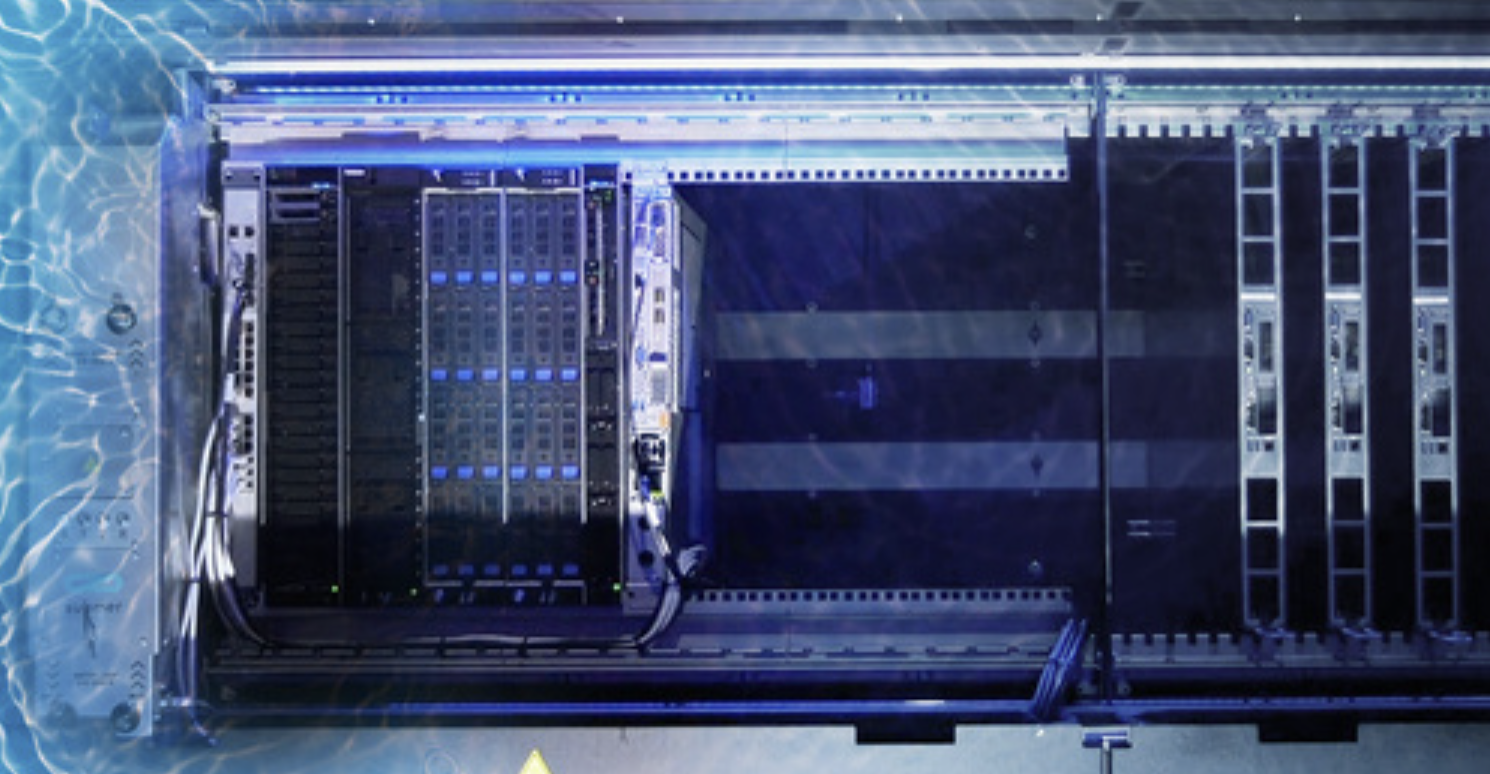
Figure 6: Single-phase immersion cooling server20
Two-phase immersion cooling
Two-phase immersion cooling goes one step further by using engineered cooling fluids that have a low boiling point and therefore partially evaporate during operation. The gaseous cooling fluid rises from the immersion bath, condenses on a condenser coil, and drips back into the immersion bath (Figure 6). This additional phase change offers even more efficient heat transfer, as the evaporation of a liquid requires a particularly large amount of heat and enables an even higher power density in the data centers21. However, two-phase immersion cooling systems sometimes require liquids that may no longer be used in Europe in the future due to the new PFAS regulation. This is either due to the high toxicity or climate-damaging potential of the liquids22, 23.
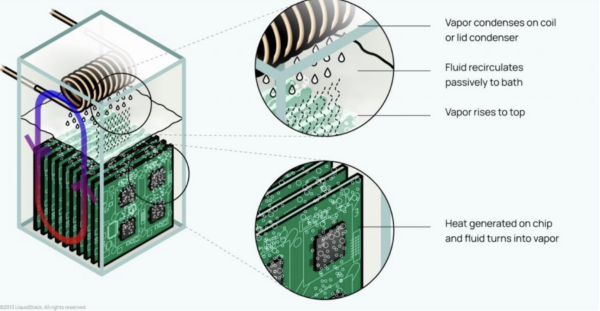
Figure 7: Passive two-phase immersion cooling24
Comparison of cooling technologies
Table 3 compares the three liquid cooling technologies described with the conventional variants of air-cooled data centers in terms of their temperature level, heat transfer and energy efficiency, among other things. The following schematic diagrams illustrate the compared cooling variants.
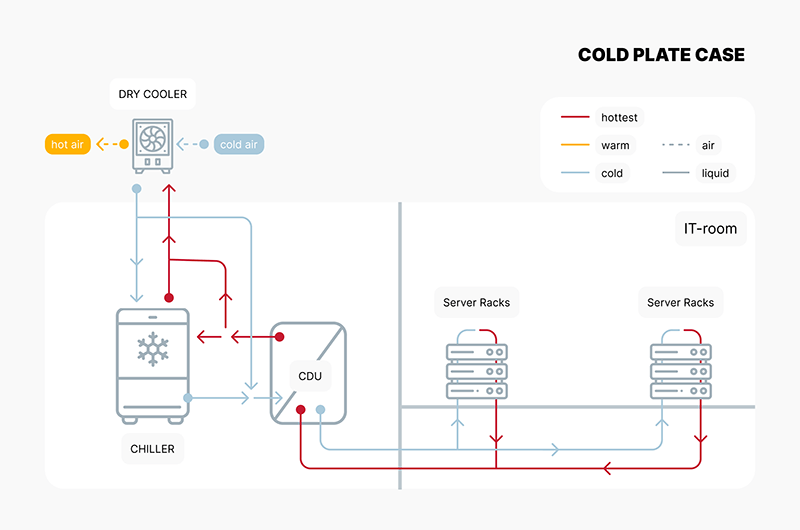
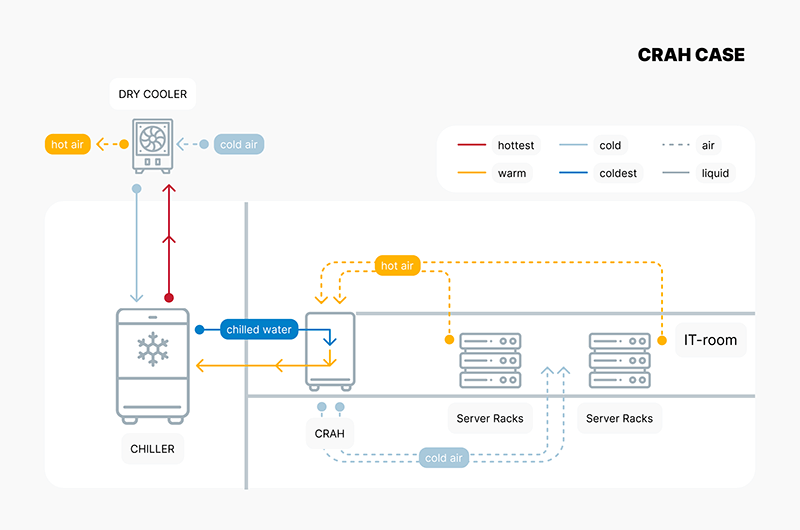
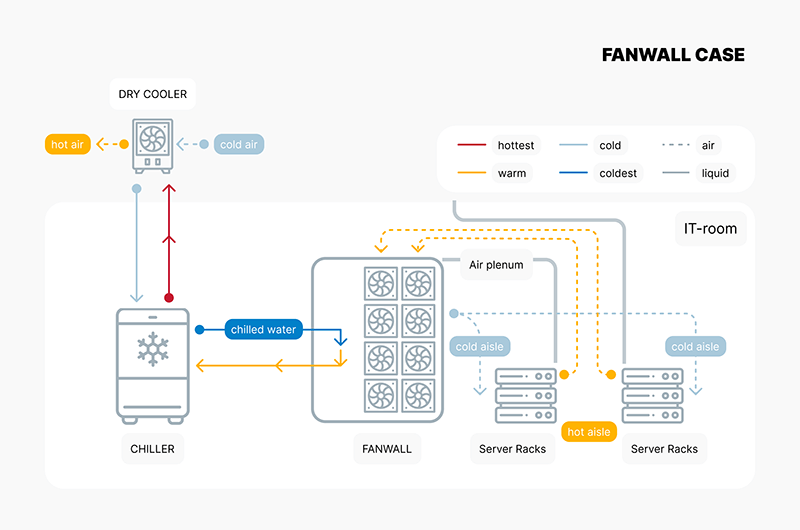
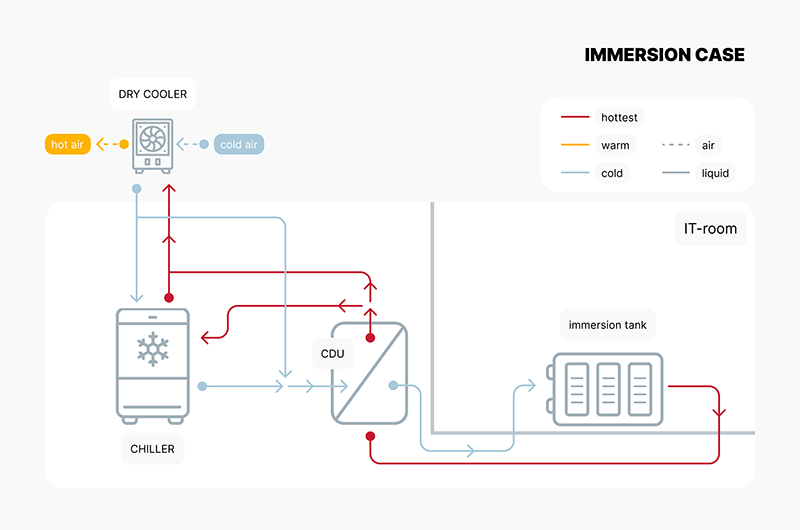
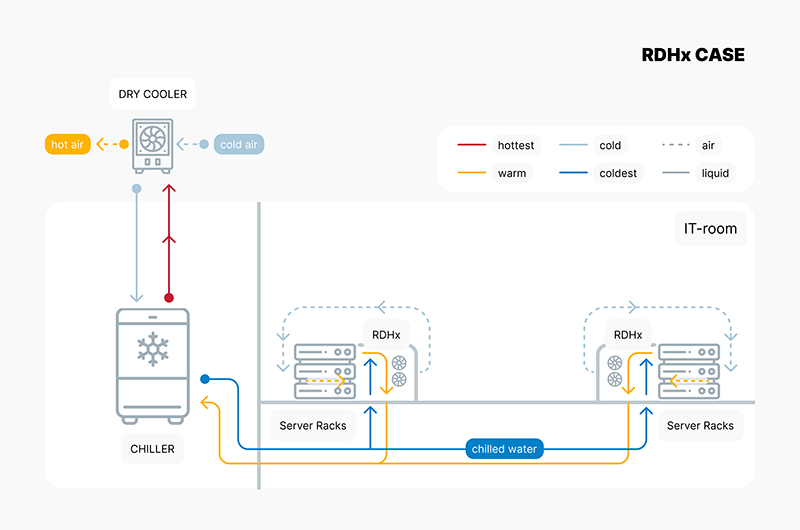
Table 3: Comparison of liquid- and air-cooled data centers
Direct to chip liquid cooling and immersion cooling can achieve the highest temperatures in the coolant circuit, potentially enabling year-round free cooling and offering good waste heat utilization potential. Using the annualized Mechanical Load Component (MLC) of 0.13 to 0.25 defined by ASHRAE for data centers with more than 300 kW IT power25, and assuming the contribution from pumps + fans to an MLC of maximum 0.05, the cost savings of reaching higher temperatures allowing free-cooling (or heat reuse) can be phenomenal (a reduction to up to a fourth of the energy needed for cooling). These savings can offset the higher costs that the liquid-cooled servers may incur.
The technology comparison then looks at system differences in the white space’s structure, operation, maintenance, and servicing.
All three liquid cooling technologies do not generally need an enclosure and ducts for air routing in the white space, as rather little warm air is generated away from the rack.
Compared to air-cooled systems, direct to chip liquid cooling and immersion cooling are also characterized by a lower space requirement, resulting from the higher power density of the servers and the elimination of air-to-air heat exchangers thanks to compact liquid-to-liquid heat exchangers.
Immersion cooling is theoretically a simple technology that saves on the development of component-specific heat sinks and often chiller investment. On the other side, however, even though maintenance should be theoretically lower, maintenance actions can be time-consuming, as the servers have to be drained after they have been removed from the cooling fluid. Furthermore, the cooling fluids used in immersion cooling can be costly and challenging, and some of them will be affected by the newest P-FAS regulations. Moreover, there is a myriad of different fluids which complicates compatibility within systems and warranty procedures. Like many new technologies, it will need to overcome its first hurdles. Standardization, natural refrigerants and potentially robotized maintenance will improve its deployment at scale.
Cooling requirements of IT-application
Liquid-cooled servers are often used in environments where high power density is required and conventional air cooling systems are not sufficient. As shown in this article, there is a particular advantage of liquid cooling in computing areas requiring high power densities26. While until recently liquid-cooled data centers were more common in research facilities in supercomputers, the number is also increasing in commercial cloud computing data centers, in particular the ones dedicated to train AI Large Language Models27. However, this technology is also suitable for other applications. It depends specifically on the technology installed and the conditions of the location. For data centers in temperate climates, liquid cooling can eliminate the need for a compression chiller28. This reduces power consumption and significantly lowers initial capex29.
Conclusion
In summary, it can be said that liquid cooling in data centers is suitable for all IT applications, but it has mainly been deployed for applications with high computing power, where it seems superior to air-cooled systems due to its higher heat capture capacity per surface unit.
Liquid cooling also performs better in terms of sustainability due to its higher energy efficiency, especially cold plates and immersion cooling using higher temperature levels and hence a higher free cooling ratio. The elevated temperature level also offers the potential for waste heat utilization, with associated energy and CO2 savings elsewhere30.
All the liquid cooling variants presented are operated with a cooling circuit up to the rack. Due to the usage of a common infrastructure for liquid cooling to and in the white space (piping, CDUs, heat exchangers, etc.), air-cooled (using liquid indirectly), liquid-cooled cold plates and immersion-cooled servers can be installed and operated parallelly. At the same time, it is possible to react cost-effectively to the growing application requirements of AI and data analysis by replacing racks or servers without having to completely modify the existing facility infrastructure in the data center. Future data centers will have coexistent systems to face the different computing needs. To have an AI-ready data center means that this has been considered in the design and that the data center can host high-density servers while hosting traditional less dense IT equipment (source AQC).
Exciting innovations are being explored in the field of liquid cooling for IT technology and data centers, which could further improve the efficiency and reliability of cooling technology. These innovations will be explained in a future article.
[1] https://www.datacenterdynamics.com/en/analysis/an-introduction-to-liquid-cooling-in-the-data-center/
[2] https://www.pcmag.com/how-to/pc-cooling-101-how-to-buy-the-right-air-or-water-cooler-for-your-desktop
[3] https://www.computerhistory.org/revolution/mainframe-computers/7/161
[4] https://www.datacenterdynamics.com/en/opinions/ten-years-liquid-cooling/
[5] https://www.esmagazine.com/articles/101454-free-cooling-in-buildings-opportunities-to-drive-significant-savings#:~:text=The%20third%20mode%2C%20100%25%20free,with%20the%20compressors%20turned%20off
[6] https://www.opencompute.org/documents/guidelines-for-using-propylene-glycol-based-heat-transfer-fluids-in-single-phase-cold-plate-based-liquid-cooled-racks-final-pdf
[7] https://submer.com/blog/what-is-immersion-cooling/
[8] https://www.sciencedirect.com/science/article/am/pii/S0017931019336002
[9] https://www.gigabyte.com/Enterprise/GPU-Server/G190-H44-rev-531
[10] ASHRAE (2021), „Thermal Guidelines for Data Processing Environments, Fifth Ed.
[11] https://schroff.nvent.com/en-in/solutions/schroff/applications/new-high-performance-rear-door-cooling-unit
[12] https://www.ashrae.org/file%20library/technical%20resources/bookstore/supplemental%20files/referencecard_2021thermalguidelines.pdf
[13] https://www.stulz.com/de-de/produkte/detail/cyberrack/
[14] https://www.carel.com/blog/-/blogs/liquid-cooling-for-data-centres-from-niche-to-mainstream-?utm_source=twitter&utm_medium=social&utm_campaign=tw_pub_org_20220324_blog_liquid_cooling_for_data_centres_from_niche_to_mainstream_
https://eepower.com/technical-articles/smart-water-cooling-for-servers-and-data-centers/
[15] https://www.supermicro.com/solutions/Solution-Brief_Supermicro_Liquid_Cooling_Solution_Guide.pdf
https://www.servethehome.com/supermicro-custom-liquid-cooling-rack-a-look-at-the-cooling-distribution/
https://www.theregister.com/2022/11/08/colovore_liquidcooled_datacenter/
[16] https://www.cloudandheat.com/referenz/thomaskrenn/
[17] https://www.servethehome.com/qct-liquid-cooled-rack-intel-sapphire-rapids-bake-off/
[18] https://koolance.com/hd-60-hard-drive-water-block
[19] https://blog.ovhcloud.com/new-hybrid-immersion-liquid-cooling-developments-at-ovhcloud/
[20] https://www.gigabyte.com/Industry-Solutions/submer-single-phase-immersion-cooling
[21] https://www.gigabyte.com/de/Press/News/1972
[22] https://news.3m.com/2022-12-20-3M-to-Exit-PFAS-Manufacturing-by-the-End-of-2025
[23] https://www.umweltbundesamt.de/eu-beschraenkt-verwendung-weiterer-pfas
[24] https://liquidstack.com/2-phase-immersion-cooling
[25] https://www.ashrae.org/file%20library/technical%20resources/standards%20and%20guidelines/standards%20addenda/90_4_2022_g_20240131.pdf
[26] https://blog.qct.io/de/wasserkuehlung-fuer-ki-und-supercomputing-was-sind-die-groessten-herausforderungen/
[27] https://www.supermicro.com/en/solutions/liquid-cooling
[28] The usage of a compression chiller. The choice to install it or not would be based on maximal historical temperatures, and hardware types. In general, a very cold climate is needed and/or evaporative cooling to be able to free-cool 100% of the hardware (it is quite uncommon to have a data center with 100% liquid-cooled hardware).
[29] https://www.vactis.it/direkte-freie-kuehlung-und-wasserkuehlung-welche-methode-ist-fuer-tlc-raeume-und-rechenzentren-zu-waehlen/
[30] Reference to our blog article: Who called it a waste?
Net zero operation through a clean power strategy
Introduction
The data centre industry is almost exclusively driven by electrical power. Power comes generally from the power grid into the installation, and it is distributed to the IT equipment (ITE) and the auxiliary elements required to maintain the needed environmental conditions. To influence the operational environmental footprint of the data centre, one of the most evident fields it seems imperative to attack is the source of the electricity supply. In this article we will see the different angles one can take to establish a clean power supply strategy, from employing conservative and non-technological measures to more radical and complex actions. We will also briefly treat the societal challenges that can bring renewable energies and their access to them and finally show that the electricity supply to the data centre is not the only source of clean power that a data centre is related to, but also the excess heat resulting from its operations.
Power purchase agreements (PPAs):
The most common way of decarbonizing the sourcing of electrical power is by contracting PPAs. Besides ensuring fixed prices for future operations, PPAs buyers are interested in the renewable energy certificates (RECs) that are associated to the renewable assets. For every MWh produced, the asset has the right to claim for a REC, which endorses the renewa- ble origin of that energy produced, generating what we also call guarantees of origin (GOs). PPAs usually include these certificates, which allows the buyer to claim the responsibility of the avoided emissions.
There are generally two sorts of PPAs: virtual/financial PPAs and physical PPAs. The first ones are a hedging mechanism where the buyer agrees on a strike price with the seller. The agreement will be financially settled based on the difference between the strike price and the wholesale market price: if strike price is higher than the wholesale market price, the buyer would pay the difference but if the strike price is lower than the wholesale market price, the seller will pay the difference to the other party. A virtual PPA will be backed by the producer with a number of assets (mostly renewable), but these will not be necessarily explicitly linked to the agreement.
On the other hand, in a physical PPA, the buyer buys the energy directly from the asset at the strike price. There is a physical transfer of the energy from the asset to the grid but as it seems obvious, there will be times when these assets do not generate any electricity even if the consumer will still need to be supplied. The power consumed will then have to come from other assets connected to the grid and hence the real carbon footprint will equal the one to the grid at that moment. With physical PPAs a volume of clean energy is purchased for a period of time and in total, that volume purchased by the buyer will be carbon-free but not on an hourly basis.
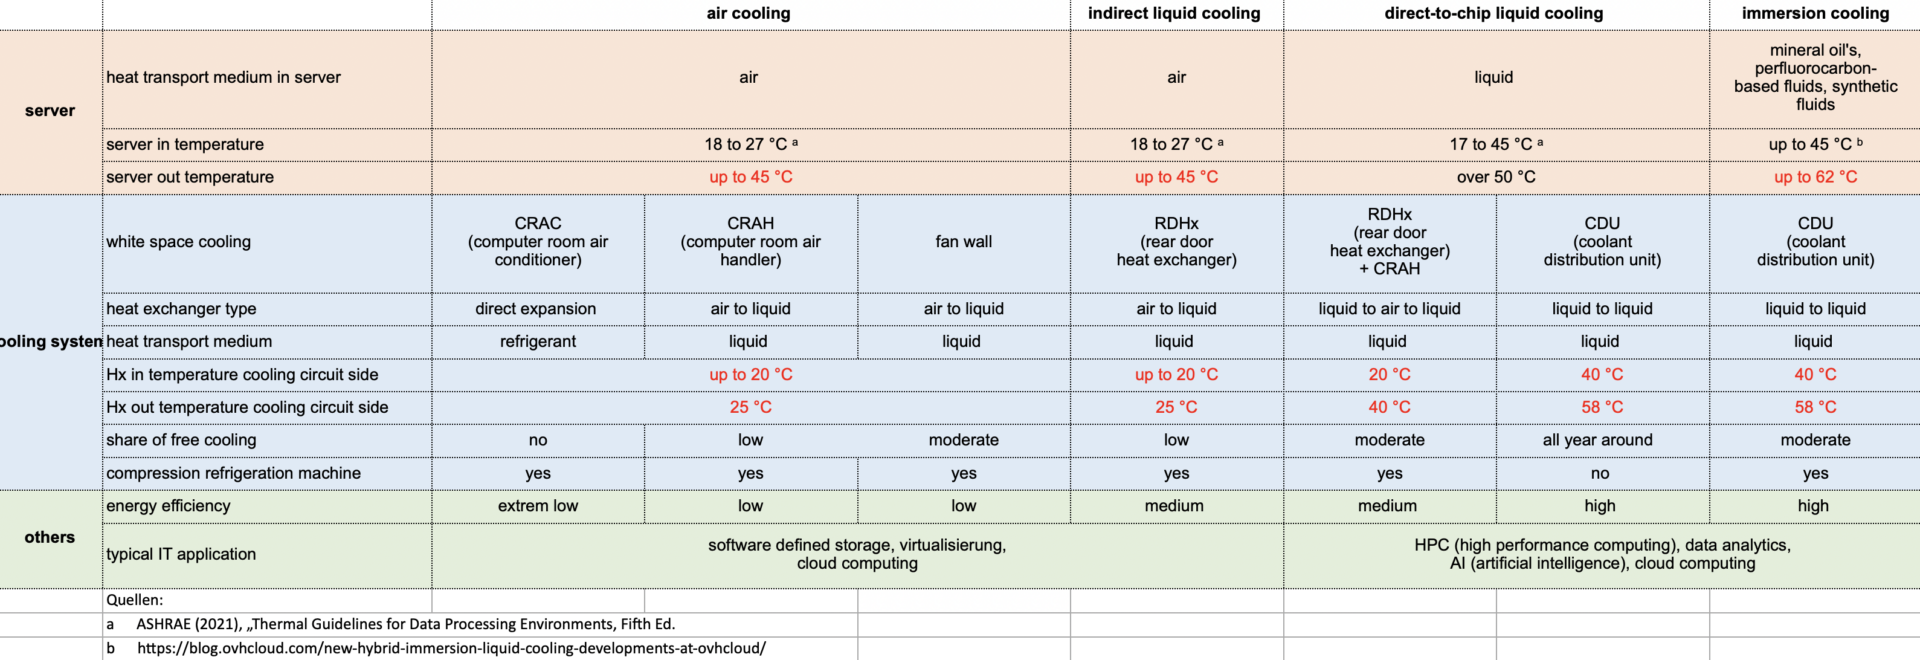
There are different kinds of physical PPAs depending on the way the power is produced and consumed (see Figure 1).
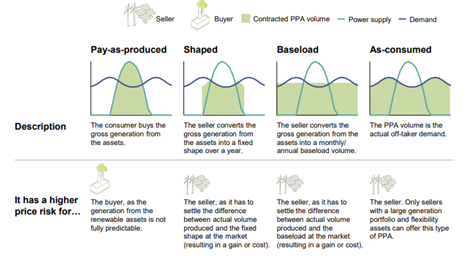
Figure 1 – Different types of structures for physical PPAs. Source: LDES Council and McKinsey1
24/7 renewable energy PPAs:
There is a way of purchasing energy that is getting more attention from the corporations willing to reduce their operational carbon footprint: 24/7 matched PPAs. While a PPA based exclusively on solar or wind energy can reduce up to 70% (see Figure 2) of the emissions compared to dragging power from the grid, a 24/7 matched PPA aims to equalize power consumption from the buyer and electricity generation within an hourly basis. Please note that clean energy also can include non-renewable energy sources without GHG emissions or whose emissions are completely captured and stored or transformed.
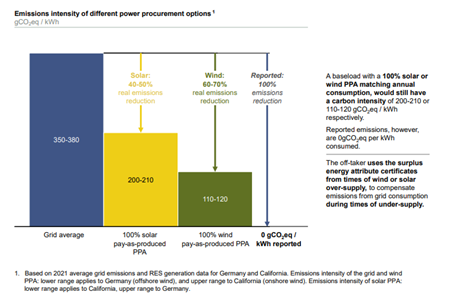
Figure 2 – Estimation of real emissions per electricity unit for different types of PPAs. Source: LDES Council and McKinsey2
Each megawatt hour of energy used has to be backed by a megawatt hour of renewable energy supplied within the same power grid. This is done by essentially two means: accurately measuring -at the energy source and at the consumption- and oversubscribing a mix of renewable electricity generation, which will definitely make this product a more expensive one (see Figure 3)
Figure 3 – Costs (in €/MWh) for 24/7 consumers for different energy purchase strategies targeting clean energy supply in year 2025 in 4 different countries (Ireland -IE-, Germany -DE-, Denmark -DK- and the Netherlands -NL-), taking as a base scenario (100% RES) a purchase strategy covering the annual consumption with renewable energies (mostly employing a PPA) and comparing it with scenarios with different Carbon Free Energy (CFE) targets (98% and 100%) using different technology palettes (Palette 1: onshore wind, utility slcae solar, battery storage, Palette 2: adding long-duration energy storage, Palette 3: adding gas power plant with 100% GHG capture sequestration and clean dispatchable technologies such as closed-loop geothermal or nuclear systems)3
The utility or the electricity producer will need to allocate for this contract several renewable assets of different kinds capable of covering the power demand of a data center all through the day and the year on an hourly basis. A 24/7 matched PPA is, as for now, the best way for a company to be sure that the carbon footprint of the grid power sourcing is at a minimum. On top of that, 24/7 PPAs, due to the overdemand of renewable power generation, will also have an impact in the amount of renewable power released into the grid but not delivered to the buyer (for those times where the consumption is lower as the generation), generating surplus of renewable energy that can be stored and released afterwards or can be sold to the grid, hence making more clean power available to the local grid and its communities3,5.
Right to renewables?
Since the amounts contracted are very high, PPAs have usually become a mechanism only in the hands of powerful companies to reduce their scope 2 emissions. PPAs would then allow corporations to achieve part of their sustainability goals while that renewable energy power results less available to the rest of the society, who has then to “resign” and use a power mix with less carbon free and more expensive sources. PPAs are increasing in number and in some European countries such as Spain, PPAs are covering nearly 10% of the total capacity 6,7. Data centre industry is getting a higher contribution to the global power usage (up to 1,3%) and data centre companies are among the top five corporate offtakers of renewable power purchase agreements. Resistance is being held from local communities regarding the new developments and its high requirements on (renewable) power supply9.
Usually, the PPAs are backed by renewable power plants built expressly for the power purchaser but it is inevitable to believe that if the global potential of building these plants is X and companies are requiring for their PPAs Y capacity, the potential available for the rest of the society will be X -Y. Ultimately, we can postulate that some power purchasing policies could act against the UNSDG 7, the access to clean and affordable energy to everyone10. A good practice in the industry and, in particular the data centre sector, could be to neutralize the capacity used by their developments by adding an increment of the same capacity in the power generation stock via new renewable energy plants. This is something it can only be done if the data centre and the renewable energy power plants developers are within the same planning umbrella: to assign to each MW of data centre capacity an additional MW of redeployed renewable energy somewhere else within the same region to neutralize the potential impact caused to the renewable proportion of the power grid left available to the rest of the society. This principle of not using existing power capacity but building new can be called “additionality on renewable energy capacities” and is being prone by companies such as Google11 or AQ Compute12. This latter even doubles the bet and ensures that any new data centre project will automatically have associa- ted extra renewable power development besides the one that is going to need on its own.
On-site generation:
Ideally, a data centre would be able to directly produce the renewable power it needs. Direct power generation hap- pens on-site or at a nearby plot (less than a couple of km) making possible a direct connection. Some hyperscalers are already outfitting their developments with on-site power plants13. The biggest challenge associated with this is to remain reliable and at the same time have a zero-carbon footprint. The power plants we are seeing on data centre sites are rat- her nuclear plants14 or gas turbines11. The latter is a very reliable source of energy (can be sourced by a pipeline, can be easily stored and the infrastructures and logistics associated to it are well established) but not the most efficient nor the cleanest one (max. 60% efficiency for combined cycle plants and 0,2 kgCO2eq/kWh el15). The price of renewable energy generation is decreasing year after year (see Figure 4)
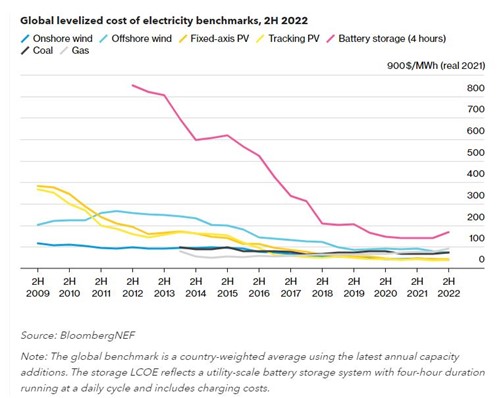
Figure 4 – Global levelized cost of electricity (LCOE) of different production sources16
The idea of owning your own power supply it is not new at all and has been historically practiced by some industrial sectors such as the metallurgy. As mentioned before, the impulse to be greener and hence more accepted by society is very powerful in the data centre industry. It seems logical to put the focus on decarbonizing the power supply in such an electricity driven sector, so we are seeing the first cases of onsite renewable generation. Gas turbines ran with H2 could be the first step, but they do not solve the emission of NOx linked to the burning of the fuel. Instead, H2 fuel cells are being shaped as an alternative so far17. Developing wind and solar parks directly linked to data centres18 are also un- dertaken projects by other companies19, sharing the plants the same plot with the data centres or being in a reasonable distance from the data centre, and commonly in combination with energy storage facilities. Other future technologies such as geothermal electricity generation (using the organic Rankine cycle) are showing that the response will need to be multi technological to become truly carbonless while remaining reliable.
On-site storage:
Besides the generation, the focus is to be set in the energy storage since, even having an outnumbered quantity of renewable energies on site will never ensure a total match with the data centre consumption. Some tech companies are involved in the Long Duration Energy Storage (LDES) Council and equally advocate for a multi-technological response to the energy storage problematic20. Lithium-ion batteries are still dominating among the chemical batteries, but other ones are showing their potential such as flow and solid-state batteries. Other methods to store energy are compressed air batteries21 (air is compressed into an underground hole employing excess of electricity and will return electricity as it is released through a turbine) and gravity storage22 (lifting “bricks” with the excess energy and recovering it from its fall, actioning an electrical generator).
Energy storage will be key for data centres because it does not only allow a higher ratio of clean energy but can also ensure the reliability of the data centre, delivering back-up power in case of power supply failure, allowing to mitigate the usage of diesel generators that are being employed so far. A data centre could theoretically run 24/7 on them but most always relies primarily on the power grid because it is cheaper and cleaner. Diesel gensets are then chosen as a “safe net” and are mostly used for routine checks 10 to 30 hours per year. The consumption and pollution of the diesel generators (the main contributor to the Scope 1 emissions) represents less than 1% of the typical carbon footprint of a data centre company23. Diesel gensets would run less than 30 hours per year for maintenance reasons and in the worst cases for 1 to 2 days until the major failure that caused their usage can be repaired. The economics still do not justify on its own the exchange of a diesel genset with an adjacent fuel tank dimension for 48h operation by an equivalent density of Lithium-ion batteries for the same duration (see Figure 4).
There might be a moral duty (if regulation is not forcing us before) to tackle this last step to get to zero carbon ope- rations, but also the deployment of back-up generation alternatives to diesel gensets could serve a supplementary objective. By deploying large scale clean energy storage facilities, the data centre could also act as a grid stabilator and offer its surplus of renewable energy to the grid. As a matter of fact, some regional power grids offer important fees to big consumers to suddenly and temporary disconnect them from the grid in order to re-equalize the frequency24 when needed. Analogously, a data centre can decide to disconnect itself from the grid during power price peaks to reduce its operating costs and even carbon footprint (highest power grid prices occur when renewables are not enough to face the demand and non-renewables enter the mix)25. This is where H2-based technology in combination with other storage mechanisms could become so relevant. Moreover, the installation of large-scale back-up systems could support the power grid in its decarbonizing mission. The data centre could hence become a power “prosumer” instead of being only a consumer.
Operational “waste”
The data centre as the core of a multi-faceted development does not need to be only limited to the power it consumes and the related PPAs, on-site generation or storage. The IT equipment (ITE) hosted in a data centre employs electricity in essence to store and manipulate information using mostly microelectronics (some photonics as well), in essence chan- ging the status of bits. By doing this, almost the entire energy supplied to it is transformed into heat (see Figure 5). All the other auxiliary elements present at the data centre are also mostly electrical energy based. Power switching, trans- mission and storage devices generate around 5-10% of losses, which are released in the form of heat. Rotating machines in charge of moving masses such as pumps and fans are ultimately transferring their energy into the environment in the form of heat as well. Compression cooling machines add electrical energy to drive thermodynamic processes, transfer- ring the heat from the ITE to the outside.
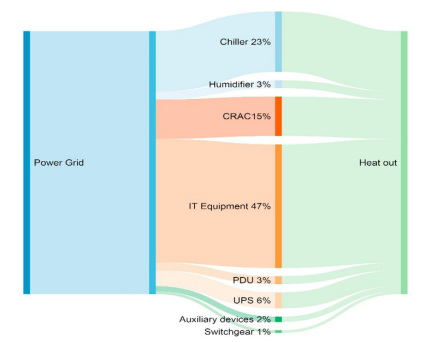
Figure 5 – Approximative flow diagram for the energy balance inside of a data centre. Source: Yang Luo et. al, A decision support system for waste heat recovery and energy efficiency improvement in data centres, Applied Energy, Volume 250, 2019, Pages 1217-122426
We need to get used to seeing a data centre not as a huge electricity consumer but as an important thermal source. Heat recovery has been done since around a century in industrial contexts and as a byproduct of electricity generation. While heat reuse from data centres is not a very common practice is currently gaining a lot of attention and several projects have been already developed, in particular in Europe as shown in Figure 6.
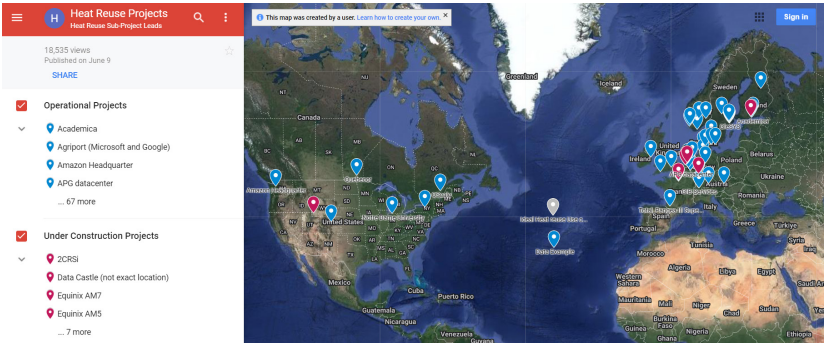
Figure 6 – Data centres’ heat reuse map. Source: Open Compute Project, Heat Reuse Subproject
Heat reuse in data centres might soon become a necessity since some local legislations are exploring to require this feature for data centres or at least prove that is not possible to do it27,28.
Excess heat from data centres can be of different qualities and quantities but there are numerous potentials offtakers of that heat:
- Residential: heating and domestic hot water
- Industrial: preheating, cleaning, drying processes among others
- Agricultural: greenhouses, fish farming
- Others: adsorption and absorption cooling, water treatment
Whereas an industrial process will usually require higher temperatures, floor heating used for greenhouses or residential heating can work with temperatures under 30°C. The easiest way to do heat reuse would be to partner with a utility that could remove the heat away from the data centre at the temperature is generated, as if it was a free-cooling method, allowing the data centre to spare chiller time. Nevertheless, the usage of heat pumps for elevating the temperature and storage facilities to sync the heat generation with the heat demand of the offtaker could be recommended. At the utility side, independently from the availability of data centre excess heat, heat pumps developments are equally being considered, especially since the increase of gas prices in the past years29. These heat pumps must extract in the worst case the heat from the ambient air, which in winter can fall under negative °C or as a better alternative use a river with relatively constant positive temperatures. The usage of a waste heat from a data centre of around 30°C would bring a better energy balance and hence savings to the utility. Other fields where currently high-grade temperature heat is used but, with due investigation and at a cost of lower efficiencies, lower temperatures could be employed, are for electricity generation and carbon capture.
Besides the energy and money savings to both parties (the data centre and the offtaker), excess heat reuse has carbon emissions reductions associated. Data centre provider employs less energy to cool, so generates less carbon emissions and will be indirectly responsible for the avoidance of carbon emissions associated to the alternative heat generation that should have been taken place at the offtaker (for example by the usage of a gas boiler to heat).
Conclusion
During this article we have seen how important is to structure a clean energy supply strategy, considering not only a solid purchase strategy but also the technicalities behind its origin. To ensure that the received energy is being simultaneously produced at a renewable power plant can virtually ensure that a data centre is being supplied 100 % with renewable sources.
An aspect that is rising concerns within the population is the increasing control over the renewable energy park by corporations with high demand needs and high purchasing power. Active efforts are being made by some companies at the forefront to ensure that data centres will contribute to add renewable power to the grids instead of depleting societies from this good.
Being directly attached to a clean power supply is probably the best option to ensure a high ratio of real renewable energy flowing into the facility but results also as the most challenging one to ensure reliable and continuous clean energy supply. At that point is where the energy storage technologies become relevant, adding as a benefit for data centres to be turned into active pieces of clean power grids, either disconnecting from the grid to help with the distortions caused by the difficult to predict renewable sources entering and exiting the grid or even acting as “prosumers” and feeding in the grid with their energy surpluses.
These surpluses are also notable in the field of thermal energy, since almost all the energy employed by a data centre is turned into heat that could be potentially used for other applications. These applications range from facilitating simple space heating and supporting known industrial processes to enabling water treatment or cooling energy generation or even more future-oriented carbon capture or electricity generation.
Via scaling up the developments and the interconnected mesh of data hosting, the positioning of data centres as the cornerstone of a broader energetic ecosystem seems inevitable (see Figure 7). We will probably have to be used to seeing data centres not as a risk but rather as a chance for the decarbonization of energy grids.
Further analysis should be done to evaluate the decarbonization of the energy supply together with other highly important KPIs, such as potable water consumption, materials usage and other environmental impacts and their mutual correlations.
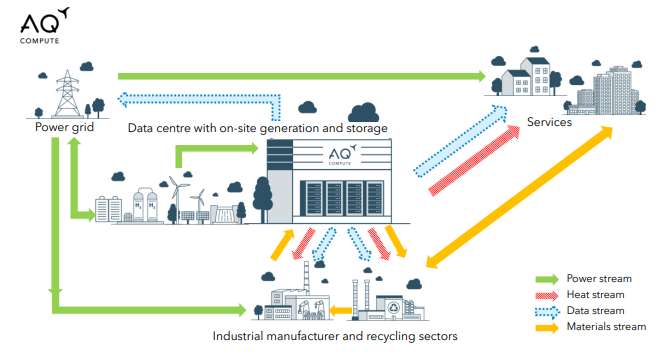
Figure 7 – The data centre as the cornerstone of an energetic ecosystem. Source: AQ Compute
Sources:
[1] A path towards full grid decarbonization with 24/7 clean Power Purchase Agreements, LDES Council and McKinsey, May 2022
[2] A path towards full grid decarbonization with 24/7 clean Power Purchase Agreements, LDES Council and McKinsey, May 2022
[3] Riepin, Iegor, & Brown, Tom. (2022). System-level impacts of 24/7 carbon-free electricity procurement in Europe. Zenodo, p.45. https://zenodo.org/record/7180098
[4] Never zero if we consider indirect emissions associated to the production and distribution of renewable power.
[5] Riepin, Iegor, & Brown, Tom. (2022). System-level impacts of 24/7 carbon-free electricity procurement in Europe. Zenodo, p.61. https://zenodo.org/record/7180098
[6] https://www.spglobal.com/commodityinsights/en/ci/topic/european-ppa-energy-market-continues-to-grow.html
[7] https://www.statista.com/statistics/1002759/installed-power-capacity-in-spain/
[8] https://www.iea.org/reports/data-centres-and-data-transmission-networks
[9] https://www.europod.eu/episode/ep-5-resistance-against-data-centers-in-the-netherlands-europe-talks-back/
[10] https://www.un.org/es/desa/universal-access-sustainable-energy-will-remain-elusive-without-addressing-inequalities
[11] https://sustainability.google/operating-sustainably/stories/ppa/
[12] https://aq-compute.com/
[13] https://www.datacenterdynamics.com/en/news/microsoft-planning-170mw-gas-power-plant-at-dublin-campus/
[14] https://www.theregister.com/2023/01/19/nuclear_powered_datacenter/
[15] https://www.uniper.energy/about-uniper/business-structure/energy-sales/ues-magazine/low-emission-power-generation-with-natural-gas
[16] https://about.bnef.com/blog/2h-2022-levelized-cost-of-electricity-update/
[17] https://news.microsoft.com/source/features/sustainability/hydrogen-fuel-cells-could-provide-emission-free-backup-power-at-datacenters-microsoft-says/
[18] https://www.nsenergybusiness.com/news/google-data-centers-solar-facility-tennessee/
[19] https://cloud.google.com/blog/topics/sustainability/clean-energy-projects-begin-to-power-google-data-centers https://news.microsoft.com/europe/features/as-the-world-goes-digital-datacenters-that-make-the-cloud-work-look-to-renewable-energy-sources/
[20] https://www.datacenterdynamics.com/en/news/google-and-microsoft-join-long-term-energy-storage-group/
[21] https://www.ctc-n.org/technologies/compressed-air-energy-storage-caes
[22] https://www.energyvault.com/ldes
[23] Based on Digital Realty’s ESG Report 2020, Scope1: 32,798 TCO2eq/a for a total of 5,518,773 TCO2eq/a total declared emissions.
[24] https://www.nationalgrid.co.uk/innovation/projects/system-hilp-event-demand-disconnection-shedd
[25] https://www.sciencedirect.com/science/article/abs/pii/S0360544221020387
[26] https://www.sciencedirect.com/science/article/pii/S0306261919308827
[27] https://eur-lex.europa.eu/legal-content/EN/TXT/PDF/?uri=CONSIL:PE_15_2023_INIT
[28] https://dserver.bundestag.de/btd/20/068/2006872.pdf
[29] https://www.iea.org/energy-system/buildings/heat-pumps
The data centre rush: unravelling Private Equity and M&A trends
Introduction
In recent years, data centres have emerged as a hot investment class in the world of private equity and mergers and acquisitions (M&A). As businesses increasingly rely on digital infrastructure, the demand for data centres has skyrocketed. This surge has led to a highly competitive market with stratospheric valuations and multiples. In this article, we will explore the driving forces behind this data centre frenzy, the potential for further valuation increases, and the role of edge computing in the next phase of M&A. We will also delve into the evaluation of risk in data centres as an asset class and the key drivers of value in this dynamic sector.
The Current Multiples and Attraction for Investors
The intense competition in the data centre space has pushed acquisition multiples to unprecedented levels. Valuations as high as 33 times earnings have become more common, making data centres a lucrative investment option. Investors are drawn to data centres due to several factors:
- Resilient Market: Data centres have proven to be recession-resistant and resilient during economic downturns, making them a reliable long-term investment.
- Increasing Demand: The exponential growth of data and cloud computing has driven the need for more data centres to support businesses worldwide.
- Cash Flow Stability: Data centres typically offer stable cash flows due to long-term lease agreements with tenants, providing a consistent income stream for investors.
Emerging Geographies in the Next Phase of M&A
While most of the acquisitions have occurred in the US and Europe, there is growing interest in expanding data centre footprints to other regions. The Asia-Pacific region, including countries like India, China, and Singapore, holds immense potential for the next phase of M&A. These markets have seen rapid digitization and a surge in cloud adoption, making them attractive destinations for data centre investment.
The Potential for Further Valuation Increases
As data becomes even more critical in the post-pandemic era, the demand for data centres is expected to rise further. This sustained demand could lead to even higher valuations and multiples, especially if supply struggles to keep up with the increasing need for data centre capacity.
Edge Computing as the Next Big M&A Play
Edge computing, which involves processing data closer to the source rather than in centralized data centres, is gaining traction rapidly. As businesses seek low-latency solutions for real-time data processing, edge data centres have become crucial. This shift towards edge computing is likely to trigger a new wave of M&A activity in the data centre industry, with companies aiming to strengthen their edge presence and capabilities.
Evaluating Risk in Data Centre Investments
Despite the strong fundamentals, evaluating risk in data centre investments is essential. Key factors to consider include:
- Location: The geographic location of data centres impacts their resilience to natural disasters and connectivity to major network hubs.
- Tenant Mix: Diversification of tenants across various industries reduces the risk of revenue concentration.
- Technological Obsolescence: Data centres must continuously upgrade their infrastructure to keep up with evolving technology and customer demands.
Key Drivers of Value in the Data Centre Sector
Several factors drive value in the data centre industry:
- Location: Strategic locations close to major business hubs and under-served markets add significant value.
- Energy Efficiency: Data centres with advanced cooling and energy-efficient systems result in cost savings and environmental benefits.
- Scalability: The ability to quickly scale operations and capacity to meet increasing demand is crucial for sustained growth.
Conclusion
The data centre landscape is experiencing a frenzied period of private equity investments and M&A activities, driven by the exponential growth of digital data and cloud computing. As investors seek to capitalize on the data-driven future, valuations have soared to unprecedented heights. The allure of stable cash flows, a resilient market, and increasing demand for data centres continue to attract investors. As the industry evolves, edge computing is poised to become the next major M&A play. However, amidst this frenzy, evaluating risk and focusing on the key drivers of value will be essential for successful data centre investments in the long run.
Who called it a waste?
As we all realise that our laptops are heating our legs when we use them while sitting on the sofa, one can imagine how much heat is generated from thousands of powerful servers racked together in a data centre. IT equipment (ITE) in a data centre transforms almost the entirety of energy supplied to it into heat. All other auxiliary elements present in a data centre are also mostly electrical energy based and eject heat as well. While a laptop could require around 100W of power, [1] typical servers employ 5 to 10 times more.[2]
When putting many servers together and cooling them commonly, we could gather a very valuable amount of heat. Thermal energy could be extracted and supported in a fluid, usually water. That warm water can then be easily transported and reconducted to be used for an application that has need of heat.
We hence need to grow accustomed to seeing a data centre as an important thermal source, rather than as a huge electricity consumer. For roughly a century, heat recovery has been applied to industrial processes, and especially as a byproduct of electricity generation. While heat reuse from data centres is not a frequent practice, it is currently gaining a lot of attention and several projects have been already developed, particularly in Europe. Heat reuse in data centres might soon become a necessity since some local legislations are exploring the idea of mandating to consider this feature in data centres.[3]
Excess heat from data centres can be of different qualities and quantities but there are numerous potentials offtakers of that heat:
- Residential: heating and domestic hot water
- Industrial: preheating, cleaning, drying processes among others
- Agricultural: greenhouses, fish farming
- Others: adsorption and absorption cooling, water treatment
Although some processes in the industry could employ elevated temperatures, floor heating for agricultural or residential purposes can work with temperatures around 30ºC which is the typical low-grade temperature of the excess heat generated by a classical air-cooled data centre. Heat pumps for increasing the temperature and storage tanks to sync the heat generation with the heat demand of the offtaker could be a plus.
The offtakers, regardless of whether they are a utility or not, are moving towards the electrification and decarbonisation of their heating needs, which is increasing the usage and promotion of heat pumps.[4] These will be more energy-efficient when working against a 30ºC temperature (from the data centres) than working against lower variable ambient temperature.
In addition to the economic benefits of reduced cooling and heating efforts required by data centres and offtakers respectively, excess heat reuse has clear advantages towards carbon emissions: less energy required for cooling results in reduced electricity usage and hence less associated emissions, while less energy required for heating results in lower demand on electricity, gas, or other fuels typically used for heating at the offtaker and hence also lower emissions.
It is shown that the best approach towards effective heat recovery is to form partnerships with utilities or industrial partners at the conception of a project, with partners who have heating necessities that could benefit from the waste heat of a data centre. This, in turn, results in heat being turned from a liability into an asset for both parties. The matchmaking between both activities requires good intersectoral communication (which is a challenge) and will require collaboration at different layers and will probably require the involvement of public authorities to set standards of communication and working methods.
Sources:
[2] https://www.zdnet.com/article/toolkit-calculate-datacenter-server-power-usage/
[3] https://data.consilium.europa.eu/doc/document/PE-15-2023-INIT/en/pdf
Sustainability Innovation for a Carbon Free Future
Sustainability Innovation for a Carbon Free Future
Sustainability Computing: Zero Carbon Haven at AQ Compute
Authored by Susanna Kass, Energy Fellow, Stanford University, UN SDG-EP with contributions by Jaime Comella, Lead Data Centre Architect, AQ Compute
Renewable Energy and Energy Storage are going through a breakthrough transformation in its own economics to show its promise to scale in new opportunities to power the Net Zero Data Centers with affordable, clean energy. It is proven that the hyperscalers in the past two decades; AWS, Microsoft Azure, Google GCP, Meta-Facebook, Apple are responding with Gigawatts of Renewable Energy purchases, its fence-thinking strategies to meet its Carbon Neutrality Goals.
-

- Figure 1: Renewable Energy (Shutterstock, Blue Planet Studio)
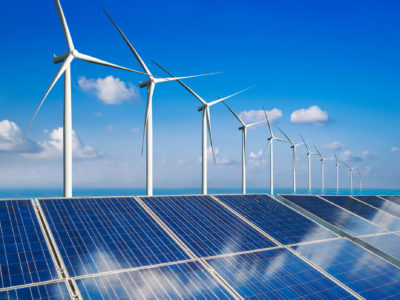
-
- Figure 2: Energy Storage (AdobeStock, malp)
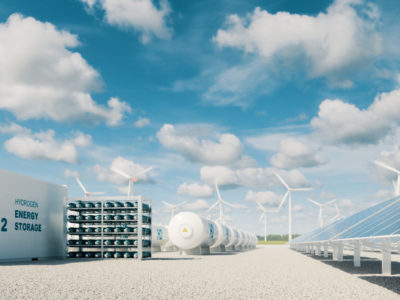
AQ Compute focus is to accelerate the growth trend to enable Carbon Neutral Data Centers throughout the Data Center Lifecycle, by introducing Zero Carbon Haven across a pan-European site portfolio to accelerate carbon free communities in European Union countries.
Data centre at the core of a renewable energy and circular ecosystem
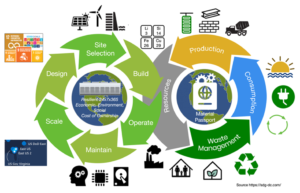
Figure 4: Circular Economy for Data Center Lifecycle Source: Susanna Kass https://sdg-dc.com
AQ Compute and its parent company, Aquila Capital, collectively are advancing more sustainable computing across an existing and future pan-European fleet of site(s) with eco-conscious, cloud-sovereign data centers, ensuring end-to-end optimal path networks, and circularity, reducing the depletion of environmental resources. Specifically, AQ Compute aims to offer a Zero Carbon Haven Computing, specifically for higher density GPU- computing and AI-driven software supporting a 24/7 renewable energy platform.

Figure 5: Clean energy infrastructure to harmonize with carbon free community (Source: Shutterstock, liyuhan)
In an industry driven by electrical power, AQ Compute is conscious of the importance of ensuring a renewable energy supply to power its data centers. The parent company, Aquila Capital has a track record in developing Gigawatt scale renewable energy projects, utility scale energy storage as an asset management company. This approach accelerates Data Center operators to get access to zero carbon emissions power supply. Net Zero Data Center gains carbon free energy of on premise renewable energy assets at AQ Compute, a Zero Carbon Haven compute platform with net positive impacts. Additionally, with Power Purchase Agreements (PPAs) for the Data Centers can accelerate to meet the Carbon Neutrality goals. AQ Compute, via Aquila Capital, stated its commitment to match per megawatt of renewable power needed by AQ Compute Data Center clients with new and incremental renewable power project development. The result is more clean energy for our people, our planet and scale for growth with profits in a carbon free future.
AQ Compute’s data centres aim to act as power grid stabilizer using its on premise energy platform and back-up systems. In times where renewable energies are massively entering into the power grid mix, frequency stabilizing mechanisms are required. Hyperscale data centers having intensive loads, are candidates that can operate continuously without connecting to the grid hence achieving resiliency with the highest uptime performance.
Each data centre has excess heat, and millions are spent in cooling technologies. The excess heat resource can be reused in the circular data centre ecosystem to provide new value to society of cost saving benefits of heating services. Sustainable Innovation includes high temperature direct liquid cooling from the ITE and CO2 as a thermal carrier to carry the excess heat from the data centre that is extracted directly from air or liquid cooling. The circular network of excess heat prototypes are working now in megawatt scale and can be ignitors in Gigawatt scale. The results are impactful to the environment; reduce hundreds of millions of GHG emissions to the environment; economic savings of not needed power to cool the data centres and reduced energy cost savings for society to receive heating from the excess heat from data centres in a circular ecosystem.
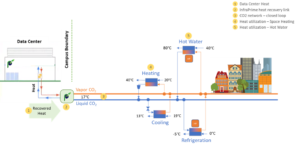
Figure 6: Heat Reuse from Data Centers (Susanna Kass)
It is an opportune time to invert the status quo of a linear economy. Net Zero data centre is a new generation to revitalize a clean energy and circular ecosystem creating new value to the communities and to the environment, by:
- Improving renewable power access of the society with additional renewable energy project developments to green the grid, triggered by the development of data centres
- Increasing resiliency of local grid with data centre technologies
- Reducing energy costs and emissions of heating for surrounding residents and businesses through access of excess heat from data centre
Sustainability Innovation
- Provides the blueprint to assess and plan for a holistic approach of Sustainable Computing which consists of high-density GPU, AI-enabled compute capacity to unleash the scale of transformative productivity gains to its full economic potential.
- Defines the pillars with a new lens towards Net Zero design for Net Positive Impacts:
- resilience (anticipate, adapt, resolve, resume) normal operation measured by zero downtime
- impact (reduce and eliminate emissions of responsible consumption and generation of energy)
- effectiveness (performance, sovereignty, security)
State-Of-the-Art computing needs also to be sustainable in its consumption of resources. AQ Compute tracks the computational capabilities trends required for modern Machine Learning systems which is measured in floating-point operations per second (FLOPS). The fact shows it has grown by hundreds of thousands of times since 2012. (OpenAI, 2018[1]; Sevilla et al., 2022[2]), despite algorithmic and software improvements that reduce computing power.
Deep learning dramatically increased the size of machine learning systems, and their compute demands. There is a shift in the industry from general-purpose processors, namely Central Processing Units (CPUs), to processors that include specialized hardware and support more efficient compute execution for certain operations (i.e., requiring less energy and achieving more computations per unit of time). Today, Machine Learning systems are predominantly trained on specialized processors that comprise hardware optimized for certain types of operations, such as Graphics Processing Units (GPUs), Tensor Processing Units (TPUs), Neural Processing Units (NPUs), and others. It is less efficient for AI systems, Security systems, Data Science Systems, Quantum Networks that correlate massive data to use traditional CPUs.
Aligning Sustainable Compute Capacity with Sovereign Cloud Strategies
To address a gap in the industry, AQ Compute Sustainability Leadership works in UN SDG-EP and is one of the Climate Experts, Researchers at The Intergovernmental Panel on Climate Change (IPCC) Group to help policy makers align sustainability policy with national clean energy standards. These considerations are not exhaustive and vary according to national contexts and needs, they are the outcome of extensive evidence-based framework by the Expert Group members and exemplify a science-based approach on how to systematically measure and plan Sustainable Computing capacity for current and future Digital Transformation Business needs. The government head of EU countries should consider AQ Compute platform to future proof its national investments relative to meeting its national policy objectives, including public-sector budget, national allocations and private-sector investments. Policy makers ought to use evidence-based models to shape the most resilient approach by the country’s context and needs. Such an approach is strategic to include the use of its investments and sponsored strategic partnerships with AQ Compute Sustainability Leadership to gain sovereignty amongst cloud providers. Policy makers can consider how public- and private-sector investments in a country Sustainable computing capacity can advance different types of policy objectives for its countries. Scaling out AI- enabled Sustainability Computing can future proof investments. AQ Compute pan-European sites enable agility and growth, at EU-scale. The scaling out approach is proven and commonly seen in countries where multiple smaller clouds are installed and replicated in availability zone(s) for resilience support to broaden access with efficiency.
Looking Beyond: Invert Status Quo To Take Action to Make Net Positive Impact

Source: UN SDG, Susanna Kass
“In my journey, I have fought for what I believe in and what the UN SDG Environmental Program and Stanford University stand for. The impact of a carbon free future is paramount for our generation. We must take action to pave the way for the future generations of people. The planet itself is resilient; meanwhile, humans are depleting our natural ecosystems at a fast pace in a linear economy; grab, use, toss.” said Susanna Kass. I lead in a way to make each moment count, which is actually the motto of Stanford University Graduate School of Business (GSB). Recently, Susanna became a member of the Stanford University GMB board Women’s Circle Growth and Ops, leading impact and analysis. Back to the Data Centers, however, I would like to take action with Data Center cloud providers as a clean cloud builder and start each day as the first working relentlessly to make a net positive impact with Net Zero providers. AQ Compute Zero Carbon Haven Sustainability Computing platform exemplifies the SDG impact.” I would like to help lead the next 30 Gigawatt of Renewable Energy Data Center projects by 2030.”
The 3 (or 5) scopes of carbon emissions
The 3 (or 5) scopes of carbon emissions
The most recent ESG commitments of carbon neutrality from sovereign states and big corporations set the carbon neutrality goal in 2050. As Lord Kelvin said: ‘if you cannot measure it, you cannot improve it’. [1] Back in 1998, the GHG (Greenhouse Gases) Protocol established three different scopes for quantifying the carbon footprint of an item (or an activity, product, etc…).[2] During the last 25 years it seems the focus of carbon emissions reduction was rather set on the ones we can directly see (such as the emissions related to the combustion of fuels), but recently the embodied emissions have become more relevant and have been set as the next step to reach carbon neutrality.
In this article we would like to address the following questions:
How are the carbon emissions scopes defined? Which elements of the data centres are accountable for which emissions? Can emissions be double accounted?
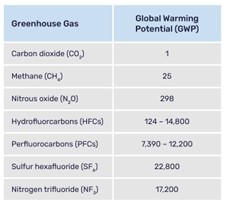
Fig.1 Greenhouse Gases and their Global warming potential. Source: IPCC 2007
First, what does Net Zero mean? The most accepted definition of a Net Zero activity or product is one that achieves the lowest possible amount of greenhouse emissions from its conception and neutralizes the inevitable emissions by removing an equal amount of them.[3] A carbon neutral activity or product will be very similar, but the focus is not set in removing the emissions: the offsetting or balancing by buying CO2 rights is more common in this case. When saying carbon neutrality, as it refers to carbon emissions, one could inflect that other GHG are not considered. There is no official definition for ‘Net Zero’ or ‘Carbon neutrality’, so, ideally, these terms should be explained when they are used.
Another important topic that needs to be addressed is the usage of the words ‘carbon emissions’. Since there are several greenhouse gases, scientists use a simplification normalizing the greenhouse effect of all GHG by comparing them to the effect of the most common one: the carbon dioxide or CO2. The parameter evaluated for the severity of the emissions is the global warming potential (GWP) during the lifetime of the GHG in the atmosphere. The global warming potential of a gas is the quantity of heat it absorbs in the atmosphere as a multiple of the heat absorbed by a same mass of CO2. As an example, the SF6 has a GWP of ca. 22,000 times higher than the CO2, meaning they potentially can absorb 22,000 times more heat than a same mass of CO2 emissions (see Figure 1). As all the GHG are reduced to a comparison with the CO2, the carbon emissions we refer to when talking about global warming effect are called CO2-equivalent (CO2e) emissions and refer as well to all other gases that are emitted during an activity.
Emissions scopes
There are officially three carbon emissions scopes, as depicted in Figure 2:
- Scope 1: direct emissions generated on-site
- Scope 2: emissions associated to electrical power or thermal energy employed in the site
- Scope 3: embodied emissions and upstream-downstream activities associated emissions, including client’s emissions associated to the usage of products or assets, end-of-life treatment, corporative emissions, capital goods
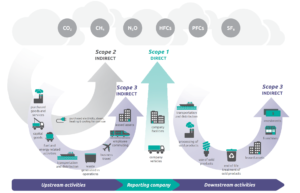
Fig.2 Representation of the three different scopes emissions. Source: WRI/WBCSD Corporate Value Chain (Scope 3) Accounting and Reporting Standard, page 5.
As we can imagine, one same activity can incur a determined emission scope for various stakeholders involved in its deployment. An easy example of this is the electricity used from the grid. To get that electricity to the consumer, it had to initially be generated at a power plant which in many cases causes some form of emissions (e.g., burning fuel to rotate turbines generating power). These emissions are classified as scope 1 for the power plant owner. The users of that electricity will not generate the same emissions themselves but can report those emissions, which for them will fall into scope 2. If these users then employ the same electricity to transform goods (for example, to cut wood and build furniture), this product, if passed to somebody else, will have, ‘embodied’ almost the same amount of emissions that the power plant originally generated,[4] but will fall under scope 3 emission for the next user of the value of chain. In this case, we call this ‘embodied carbon’, because it is an essential part of the elaboration of the product and assimilates to it existence
In data centre infrastructure, different activities can be classified into different scopes depending on the point of view chosen by the reporting party. In the following example, shown at Figure 3, we have three parties: an IT operator providing IT services based in its own IT equipment and/or facility, a Cloud operator providing Cloud services, and a Colocation operator providing data centre space and services, coupled with four scenarios in which they are interrelated when reporting about the emissions of the electrical power employed for their services.
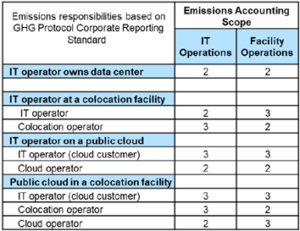
Fig.3 Emissions scopes from three different actors involved in IT and data centre services at 4 different scenarios. Source: The challenges of managing scope 3 emissions, webinar Uptime® Intelligence)
In the last scenario, where the three of them are involved, the emissions associated to the employed power are to be reported by one party, depending on the considered element. The colocation operator provides a facility with power, at a determined temperature, and will report the emissions of the facility as scope 2, but not the emissions of the IT Equipment belonging to the Cloud operator. These are reported as Scope 2 for the latter and Scope 3 for the former. The IT operator is buying services from the Cloud operator, who is offering a virtual infrastructure hosted in its ITE (IT Equipment), which in turn is hosted in a third-party data centre, so will report all the emissions as upstream emissions, belonging to scope 3.
Since all the emissions are shared by the different parties involved one could ask who is accountable for which emissions, and how these are being compensated. To simplify, if all the scope 1 emissions were avoided, there would be no emissions to be compensated on the other scopes. The same happens with the compensation of emissions. Note that a scope 1 or 2 emission only belongs to one party and is transformed into a scope 3 when it jumps into the value chain. It then remains as scope 3 emissions for all the underlying downstream parties. A scope 2 emission is always preceded by a scope 1 emission (plus a usually smaller amount of scope 3 emissions). Therefore, proper measuring and tracking of the emissions is incredibly important to know, to avoid double compensations.
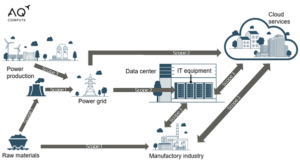
Fig.4 Interconnections of the different carbon scopes emissions. Source: AQ Compute
Table 1 shows what kind of emissions and under what scope happen at a colocation data centre:
| Scope 1 | Scope 2 | Scope 3 |
|
|
[1] Mechanical, Electrical, Plumbing |
Table 1. Examples of different emissions origins classified under the different 3 scopes. Source: AQ Compute’s own elaboration
The origin of the carbon equivalent emissions in a data centre are multiple and involve several stakeholders through the entire lifecycle: during the design phase and all the activities involved, during the procurement of materials and components and the activities of subcontracted companies, during the operational phase for the energy sourcing used also by the tenants of the data centre, and during the end-of-life phase when removing items, whether disposing of or recycling them.
We could be also imaginative and try to define two new carbon scopes:
Scope 0: all the emissions that are not generated due to avoided activities. We should always ask ourselves if what we are building or doing is really required and if not, avoid unnecessary activities and emissions. The most sustainable data centre is the one that is not needed.
Scope 4: avoided emissions that some activities of a party would generate into the emissions scopes of another party but cannot be accounted as any carbon emission scope (nor 1, 2 or 3) for the first one. An example would be the emissions avoided at a heat ‘offtaker’ by recovering the excess heat of a data centre. The avoided emissions resulting from not using gas for heat are not accounted by the data centre but are triggered by its actions. It will belong to avoided scope 1 or 2 emissions of that heat ‘offtaker’ and we could consider them as avoided emissions. On the other hand, excess heat recovery will have a direct effect in the energy efficiency of the data centre because it would need less cooling energy, hence, less power and less emissions (scope 2 emissions).
Food for thought: could water footprint be measured in the same way?
Short answer: yes. However, water footprint is not calculated along scopes 1, 2 and 3, but in indirect and direct uses: the water footprint associated to the building, manufacturing of components, assembling, power production, etc. (indirect use) and the water directly used for cooling/heating purposes, humidifying, cleaning, etc. (direct use).
Conclusion:
We have seen what is to be net zero and how important is to be able to measure the carbon footprint (rather, the carbon equivalent, a simplification of the GHG footprint) of an activity or a product to be able to achieve the ambitious goals set by the sovereign states and the biggest corporations. Due to the interrelation between different parties when dealing with different emissions, sustainability goals are to be achieved by the common work of all the stakeholders involved. Proper measurement and communication between parties is needed to avoid double accounting and to be able to set logical and realistic roadmaps for a net zero future. In the case of data centres, there are multiple sources of GHG emissions and multiple stakeholders involved. The unstoppable digitalization trend will increasingly employ more ITE and data centres and we have a chance to show this trend not as a menace but as an example to be followed by other industries.
Sources:
[1] Lord Kelvin was the mathematician and physicist who defined the homonymous temperature scale with the absolute zero as the lowest temperature possible (-273,15 ºC)
[2] https://ghgprotocol.org/sites/default/files/standards/ghg-protocol-revised.pdf
[3] https://www.un.org/en/climatechange/net-zero-coalition
[4] We should consider the losses at the generation, the transportation and manufacturing
[5] Mechanical, Electrical, Plumbing
Realising sustainable compute capacity for daily digital applications
In today’s business world, integrating ESG criteria is no longer a choice but an obligation. Sustainability is particularly relevant for the data centre industry which is characterised by a high power consumption.
In order to quantify the CO2e emissions that AQ Compute’s data centres save compared to conventional ones, a customised CO2-eq calculator has been established by AQ Compute.
This tool compares the carbon footprint of AQ Compute’s data centre AQ-OSL1 to data centres in eleven other European countries.
Read the publication: Realising sustainable compute capacity for daily digital applications
Carbon dioxide compensation – Greenwashing or a sustainable concept?
The conception of carbon certificates has created a new model of contributing to a CO2e reduction, by creating a financial instrument that allows private investors to access sustainability ecosystems. However, by turning carbon into a potentially lucrative economic model, how much of a tangible effect can carbon certificates have on the global reduction of CO2 emissions?
In this brief opinion piece, we look into the impact of the instrumentalization of carbon certificates and how the individual can contribute to the stabilisation of global warming.
Read the publication: CO2 compensation – Greenwashing or sustainable concept?